To move the needle on your sales conversion rate, you need a clear, realistic starting point. This isn't about grabbing a generic number online; it's about defining what a "good" conversion rate looks for your business.
TL;DR: Improving your sales conversion rate starts with setting an honest baseline for your industry and traffic sources, then systematically diagnosing where prospects drop off. This guide covers stage-by-stage tactics -- from tighter qualification to better follow-up -- that compound into measurably higher close rates.
That takes context.
Setting a Realistic Baseline for Your Conversion Rate
It's a classic mistake to chase a universal "good" conversion rate. The truth is, a 3% conversion rate might be incredible for a company selling high-ticket B2B software but disappointing for a DTC brand.
The number is almost meaningless without context. Your ideal baseline is shaped by a few key factors that create different standards for success. If you ignore them, you'll end up with unrealistic goals and a flawed strategy from day one.
Understand Your Industry's Benchmarks
First, zoom in on your market. Different industries have completely different customer journeys and sales cycles, which directly shapes what’s possible for conversions.
For example, the global average for ecommerce conversion rates usually sits between 2.5% and 3%. But dig deeper, and you'll see huge variations. Sectors like food and beverage can hit rates as high as 6.11%, mostly because of repeat purchases and lower price points.
On the other end, luxury goods often convert below 1.2%. This makes sense—these are expensive, considered purchases with longer decision-making windows.
This chart shows just how dramatic the difference can be.
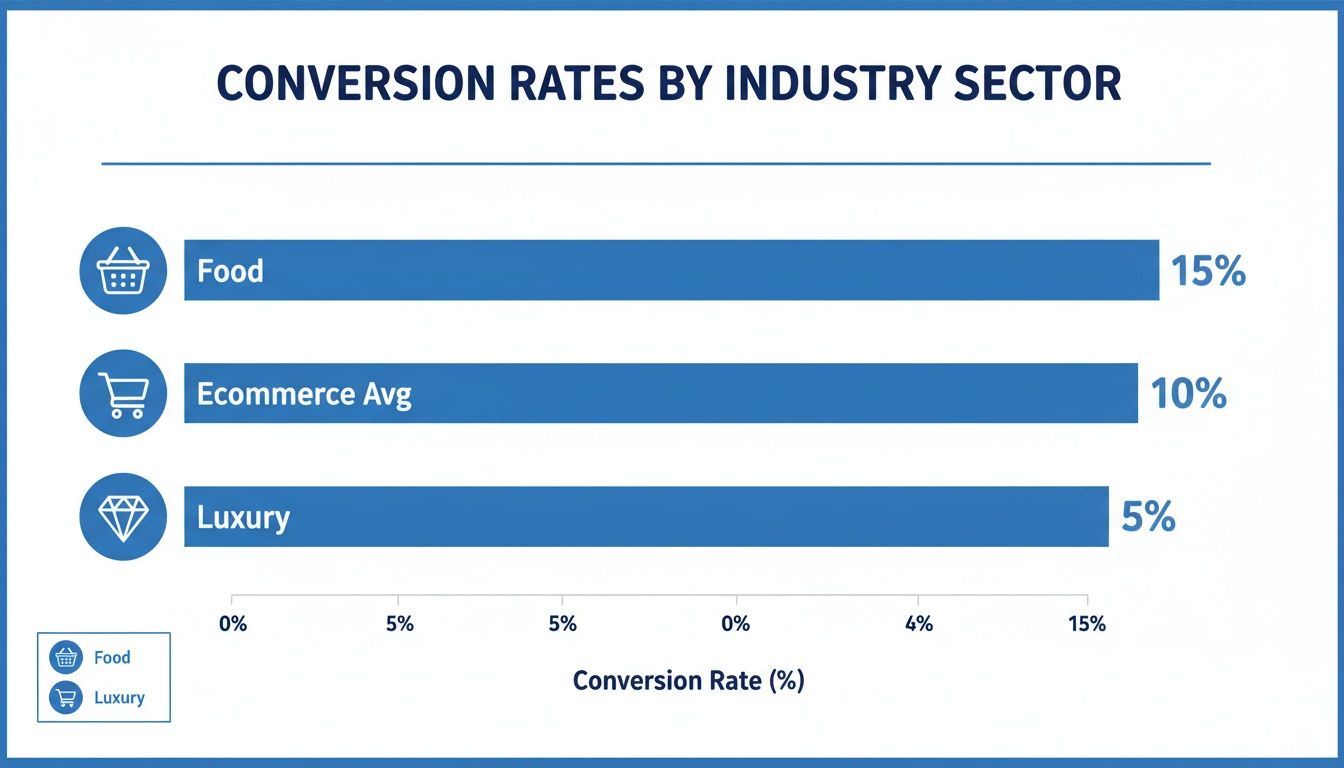
This is why a one-size-fits-all target just doesn't work. Your strategy has to be built around how people actually buy in your industry.
Analyze Your Traffic Sources and Price Point
Where your leads come from matters just as much as who they are. A prospect from a trusted referral is already warmed up and far more likely to convert than someone who clicked a social media ad. The data backs this up: referral traffic converts around 5.4%, while social media often struggles to break 0.7%.
Your price point also plays a massive role. A $50 product requires less thought than a $50,000 enterprise software subscription. Higher prices naturally mean longer sales cycles and lower initial conversion rates but usually come with a much higher customer lifetime value.
To give you a clearer picture, here’s a quick reference table summarizing typical conversion rates across different sectors and how visitors arrive at your site. Use it to help contextualize your performance.
Conversion Rate Benchmarks by Industry and Traffic Source
| Category or Source | Average Conversion Rate |
|---|---|
| Industry: Food & Beverage | 6.11% |
| Industry: Luxury Goods | 1.2% |
| Industry: B2B SaaS | ~3% |
| Source: Referral Traffic | 5.4% |
| Source: Organic Search | 2.9% |
| Source: Paid Search | 2.6% |
| Source: Social Media | 0.7% |
This table isn't a set of rigid targets but a guide to help you see where you stand. It reinforces the idea that context is king when you're evaluating your numbers.
Key Takeaway: A realistic baseline isn’t just one number. It’s a range segmented by channel, product, and customer type. Start by tracking these distinct conversion paths separately to get a true picture of your performance.
By setting a baseline grounded in your business reality, you create a solid foundation for any optimization. This data-driven starting point lets you set ambitious yet achievable goals. And before you dive into tactics, make sure you're measuring things correctly—our guide on how to calculate win rate gives you a clear framework.
See Salesmotion in action
Take a self-guided interactive tour — no signup required.
Finding and Fixing Your Conversion Bottlenecks
You can't fix a problem you can't see. To improve your sales conversion rates, you have to stop guessing and start playing detective. The goal is to hunt down the exact moments where potential customers lose steam and drop out of your funnel.
These friction points—these bottlenecks—are usually hiding in plain sight. You just need to know how to look for them.
It all starts with moving beyond surface-level numbers. Sure, knowing your overall conversion rate is a decent start, but the real insights come when you dig into the user's journey. Where are they clicking? Where do they get stuck? And most importantly, where do they give up?
Go Beyond Basic Analytics
Your standard analytics dashboard tells you what happened. For example, it might show that 70% of users abandoned their cart. It rarely tells you why. To get that critical context, you need to layer in qualitative tools that let you see the experience through your customers' eyes.
Here are a few practical ways to uncover those hidden friction points:
- User Session Recordings: Think of these as a screen recording of a site visit. You can see precisely where their mouse goes, what they click on, and where they seem frustrated or confused. It's a direct way to spot a broken form field or a confusing navigation menu.
- Heatmaps: These tools give you a visual map of user activity. They show which parts of a page get the most attention (the "hot spots") and which parts are ignored (the "cold spots"). A heatmap can quickly reveal that your most important call-to-action is basically invisible to your users.
- Customer Journey Mapping: This involves charting out every touchpoint a customer has with your brand, from the first ad they see to the final thank-you page. When you lay it all out visually, you can easily spot where the experience feels clunky or disconnected.
Good data analysis in sales is the foundation of this process. It turns raw numbers into a clear story about user behavior, helping you pinpoint exactly where your conversions are falling apart.
Map Out Your Critical Conversion Paths
Every business has key journeys they want users to take. For an ecommerce store, it’s the path from a product page to checkout. For a B2B SaaS company, it might be from a blog post to a "Request a Demo" form.
Identify these critical funnels and analyze them step-by-step. A classic B2B sales funnel, for instance, often has a huge drop-off between the initial discovery call and the demo. By breaking your process down, you can isolate the specific interaction causing the bottleneck. Our guide on defining your sales pipeline stages offers a solid framework for this analysis.
Once you’ve mapped these paths, you can start asking the right questions:
- Is the value proposition on the product page unclear?
- Is our checkout form too long and complicated?
- Are we surprising people with shipping costs at the last second?
- Is the "Book a Demo" button buried at the bottom of the page?
Each of these is a potential bottleneck that could be killing your sales.
By combining quantitative data (like analytics) with qualitative insights (like session recordings), you stop guessing and start making evidence-based decisions. This approach turns a vague problem like "low conversions" into a specific, solvable issue like "a confusing shipping options page."
Talk to Your Customers and Your Team
Finally, don’t forget your most valuable source of information: people. The data can show you what's happening, but only people can tell you the "why" behind their actions.
Start gathering qualitative feedback through a few different channels:
- Targeted Surveys: Use simple on-page pop-up surveys to ask visitors why they’re leaving. A question as simple as, "What stopped you from completing your purchase today?" can uncover valuable insights.
- Customer Interviews: Get on the phone with new customers and, more importantly, with people who abandoned their carts. Ask them about their experience—what was easy, and what was frustrating.
- Sales Team Feedback: Your SDRs and AEs are on the front lines every day. They know which questions prospects always get stuck on and where deals consistently stall. Their feedback is a goldmine for identifying friction in your sales process.
By the end of this diagnostic process, you'll have a clear, evidence-based roadmap of the biggest obstacles hurting your conversion rate. That lets you focus your efforts where they'll make the biggest impact.

“We're no longer fishing. We know who the right customers are, and we can qualify them quickly. Salesmotion has had a direct impact on pipeline quality.”
Andrew Giordano
VP of Global Commercial Operations, Analytic Partners
Arming Your Team with Conversion-Focused Tactics
Once you’ve pinpointed where your funnel is leaking, the next move is to give your team specific plays to plug those gaps. Improving your sales conversion rate isn't a solo mission; it demands a coordinated effort across your Sales Development Reps (SDRs), Account Executives (AEs), and Customer Success (CS) teams. Each role has a unique part to play in creating a smooth customer journey.

When everyone on the team understands their impact on conversion, they can work together to turn more prospects into customers. Let's break down the role-specific strategies that will empower each part of your team.
Empowering SDRs with Precision Outreach
Your SDRs are the tip of the spear. Their ability to generate high-quality meetings directly impacts every conversion metric that follows. Generic, high-volume outreach just doesn't cut it anymore. Personalization is the only way to break through the noise and set the stage for a successful sales cycle.
This means moving beyond basic firmographics and digging into deep account intelligence. Platforms like Salesmotion help by monitoring buying signals—like a company discussing a key challenge on an earnings call or posting a job for a new VP of Engineering.
Armed with these insights, an SDR can craft an email that's a timely, relevant conversation starter, not just another cold pitch.
- Instead of: "Hi [Name], I saw you work at [Company] and wanted to share our solution."
- Try: "Hi [Name], I noticed your CEO mentioned plans to expand into the APAC market on your last earnings call. We helped [Similar Company] navigate that exact challenge, resulting in a 25% reduction in go-to-market time."
This level of personalization proves you’ve done your homework and immediately frames the conversation around their goals. To get your team up to speed, a proven guide to B2B lead generation on LinkedIn is a great place to start.
Transforming AEs into Value-Driven Consultants
Once an SDR books a meeting, the baton passes to the Account Executive. This is where many deals stall if the AE jumps straight into a feature-dump demo. The AE's primary job is to connect your solution directly to the customer's pain and potential gain.
It all starts with a value-driven discovery call. The goal isn't just to qualify the lead; it's to truly diagnose their problem. AEs should ask open-ended questions that uncover the real business impact of their challenges.
AEs who run effective discovery calls shift the conversation from "What does your product do?" to "How can your product help me solve my multi-million dollar problem?" This reframing is fundamental to building a strong business case and boosting conversion.
From there, every interaction needs to reinforce this value:
- Compelling Demos: Customize the demo to show exactly how your platform solves the problems uncovered during discovery. Skip the features they don't need.
- Simplified Proposals: Make your proposals easy to understand and share. Clearly outline the ROI and connect each line item back to a business objective they shared.
- Frictionless Process: Remove unnecessary steps. Can you use e-signatures instead of requiring a print-and-scan? Can you provide a clear, one-page summary for the economic buyer?
By acting more like a consultant than a salesperson, the AE builds trust and makes the decision to buy feel like the only logical next step. For a deeper dive, check out our guide on essential sales training methodologies.
Leveraging Customer Success as a Conversion Engine
The role of Customer Success in improving new business conversion rates is often overlooked. Your CS team holds a treasure trove of insights that can make your entire sales motion more effective. They hear directly from customers about what's working, what isn't, and what they wish your product could do.
This feedback is gold for refining your sales and marketing messages. When CS identifies a common reason why customers are successful, that insight can be channeled back to the AEs to use as a powerful proof point in their demos.
Plus, a well-aligned CS team can spot expansion opportunities within existing accounts, which often have a much higher conversion rate than new business. In the B2B world, where the average eCommerce conversion rate hovers around a tough 1.8%, focusing on existing customers is a smart play. The complexity of B2B sales means every advantage counts, and insights from your current user base are one of the biggest you have.
When SDRs, AEs, and CS work in concert, the customer experiences a seamless journey. This cross-functional alignment doesn't just feel better for the customer—it's a proven way to improve your sales conversion rate.
Fostering a Culture of Continuous Experimentation
Here’s the truth: improving your sales conversion rate isn't a project you check off a list. It’s a constant loop of learning, adapting, and fine-tuning. To really move the needle, you need to shift your team's mindset—away from decisions based on hunches and toward those backed by data.
This means building a culture where every change is treated as a test and every outcome, good or bad, offers a valuable lesson.

This approach pulls your team away from risky overhauls and pushes them toward small, measurable experiments that compound over time. The goal is to create an environment where testing new ideas is not only encouraged but expected.
It All Starts with a Strong Hypothesis
Every great experiment begins with a clear, testable hypothesis, not a random idea. This isn't a guess; it's an educated prediction you build from the diagnostic work you've already done. Those heatmaps, user recordings, and customer feedback are the perfect fuel.
A solid hypothesis follows a simple structure:
- If we... (the specific change we’re making)
- Then... (the measurable outcome we expect)
- Because... (the reason we believe it will work)
For instance, a weak idea is, "Let's make the demo request button bigger." A strong hypothesis sounds like this: "If we change our 'Request a Demo' button to high-contrast orange and increase its size by 20%, then form submissions will increase, because our heatmaps show the current button blends into the page and gets ignored."
See the difference? This structure forces you to tie a specific action to a measurable KPI and justify your logic. It turns a vague suggestion into a real experiment.
Designing and Prioritizing Your A/B Tests
Once you have a solid hypothesis, it's time to design the test. A/B testing is a straightforward method to compare two versions of something—a webpage, an email, a call-to-action—to see which one performs better. Version A is your control (what you have now), and Version B is the new variation you're testing.
You'll probably have a dozen or more test ideas. You can't run them all at once, which is where prioritization is essential. One of the most effective ways to do this is with a simple impact-effort matrix.
- High-Impact, Low-Effort: These are your quick wins. Think changing button text or simplifying a form field. Jump on these first.
- High-Impact, High-Effort: These are bigger projects, like redesigning a checkout flow. Plan for these strategically.
- Low-Impact, Low-Effort: Squeeze these in if you have spare resources, but don't let them distract from bigger opportunities.
- Low-Impact, High-Effort: Avoid these. They're a surefire way to drain resources for almost no return.
Prioritizing this way ensures your team is always focused on the experiments most likely to improve your sales conversion rate.
Key Takeaway: A/B testing isn't just about finding a winner. It's about learning. Even a "failed" test gives you valuable data on what doesn't work for your audience, which is just as important for your next test.
Don't Ignore Statistical Significance
One of the biggest mistakes teams make with experimentation is calling a test too early. You might see one version pull ahead after a day or two and get excited. Don't do it. To trust your results, you have to reach statistical significance.
This concept confirms that your results aren't just a fluke. Most testing tools will calculate this for you, but as a rule, you should aim for a 95% confidence level. That means you can be 95% sure that the outcome is a direct result of the change you made.
This requires a large enough sample size—you need enough visitors or leads to see both versions of your test. Running a test for only a day, even with a ton of traffic, can be misleading. It’s better to run it for at least a full week to smooth out any daily ups and downs in user behavior.
By embracing this cycle of hypothesizing, testing, and analyzing, you build an optimization engine that continuously learns and improves. You'll stop debating opinions in meetings and start letting the data show you the way forward.
“We have very limited bandwidth, but Salesmotion was up and running in days. The template made it easy to load our accounts and embedding it in Salesforce was simple. It was one of the easiest rollouts we've done.”
Andrew Giordano
VP of Global Commercial Operations, Analytic Partners
Measuring Success with the Right KPIs
If you can't measure it, you can't improve it. While your primary conversion rate is the star of the show, focusing on it alone is like only watching the final score of a game. To really get what’s happening, you need a blend of metrics that tell the complete story of your funnel's health.
Moving beyond that one big number lets you see both the leading and lagging indicators of success. This way, you're not just celebrating a higher close rate but building a more profitable and efficient sales engine.

Go Beyond the Primary Conversion Rate
To get a full picture, you need a simple dashboard that tracks a few core KPIs. These metrics provide context, helping you understand the "how" and "why" behind your main conversion number. Think of them as the vital signs for your sales motion.
Here are the essentials to monitor:
- Micro-conversion Rate: This tracks the small wins—downloads, webinar sign-ups, demo video views. A healthy micro-conversion rate is a great leading indicator that your top-of-funnel content is hitting the mark.
- Cost Per Acquisition (CPA): This is your reality check. A rising conversion rate is great, but not if your CPA is skyrocketing with it. This metric keeps your strategy grounded in profitability.
- Customer Lifetime Value (CLV): This is the long game. CLV measures the total revenue you can expect from a single customer. Optimizing for high-CLV customers, even if their initial conversion is tougher, is what builds sustainable growth.
Monitoring these together gives you a balanced view. For a deeper look at what to track at the top of your funnel, our guide on lead generation key performance indicators provides a comprehensive list.
By tracking a mix of leading and lagging indicators, you can spot potential issues before they crater your final numbers. For instance, a sudden drop in micro-conversions could signal a problem with a new ad campaign long before it affects your quarterly sales figures.
To truly understand what's driving your performance, look beyond the surface-level numbers. The table below outlines essential KPIs that provide deeper insight into your funnel's health.
Essential Conversion KPIs Beyond the Basics
| KPI | What It Measures | Why It Matters |
|---|---|---|
| Lead-to-Opportunity Rate | The percentage of leads that are qualified and become sales opportunities. | A low rate here often points to poor lead quality or a disconnect between marketing and sales. |
| Sales Cycle Length | The average time it takes to close a deal from first contact. | A shortening cycle is a powerful sign of efficiency and stronger messaging. |
| Average Deal Size | The average revenue generated per closed-won deal. | This helps you understand if your conversion efforts are attracting higher-value customers. |
| Win Rate by Source | The percentage of opportunities won, broken down by their original channel. | This shows you exactly which channels are delivering not just leads, but revenue. |
| Funnel Velocity | The speed at which leads move through each stage of your sales funnel. | Slowdowns can reveal specific bottlenecks in your process, like a clunky demo or slow proposal stage. |
Looking at these metrics in tandem gives you a far richer, more actionable picture of what’s really going on. It’s the difference between knowing that you won the game and knowing how you won it.
Segment Your Data to Find Hidden Opportunities
An overall conversion rate can hide major performance gaps. The real insights appear when you start slicing your data into smaller, more specific segments. Break down your KPIs by channel, device, and demographic to uncover invisible patterns.
For example, data consistently shows that conversion rates differ substantially by device, location, and industry. Desktop users still tend to convert at higher rates, though mobile is closing the gap with better user experiences. Region also plays a huge role; markets like Germany and the UK often report conversion rates above 3.5%, thanks to high consumer trust. Meanwhile, global cart abandonment has climbed past 70%, often due to unexpected costs at checkout.
This kind of segmentation turns raw data into an actionable roadmap. You might discover that while your overall mobile conversion rate is low, visitors from a specific social media campaign are converting exceptionally well. That’s a clear signal to double down on what’s working and fix what isn’t.
Key Takeaways
- Establish a realistic conversion rate baseline by benchmarking against your specific industry, traffic sources, and price point rather than chasing a universal number.
- Use qualitative tools like session recordings, heatmaps, and customer interviews alongside your analytics to diagnose exactly where and why prospects drop out of your funnel.
- Cross-functional alignment between SDRs, AEs, and Customer Success is essential because each role directly influences a different stage of the conversion journey.
- A/B testing with strong hypotheses and statistical significance turns optimization from guesswork into a repeatable, data-driven process that compounds over time.
- Reducing friction at the final point of conversion, whether it is a checkout form or a demo request page, consistently delivers the quickest and largest conversion lifts.
Got Questions? We've Got Answers
Even with a solid game plan, questions are bound to come up. Let's tackle some of the most common ones we hear from sales and marketing leaders. Getting these straight can help you sidestep roadblocks and put these strategies to work faster.
What Is a Good Sales Conversion Rate to Aim For?
There's no single magic number. A "good" sales conversion rate is completely relative to your industry, business model, price point, and lead source.
For instance, global ecommerce averages float between 2.5% and 3%. But a high-impulse sector like food and beverage can see rates north of 6%, while a high-consideration industry like luxury goods might be happy with anything above 1.2%. Context is everything.
The best way to start is by benchmarking against direct industry averages. Once you have that baseline, your real goal should be continuous improvement. Aiming for a 10-20% lift from your current rate is a fantastic—and achievable—first target.
How Long Does It Take to See an Improvement in Conversion Rates?
The timeline for seeing results boils down to two things: the scale of the change and your sales volume.
Simple, high-impact fixes—like clarifying a call-to-action button or trimming steps from your checkout process—can show a noticeable lift within a few weeks, especially with decent website traffic.
For an A/B test to give you trustworthy results, you need to hit statistical significance, which can take anywhere from a few days to several weeks depending on your traffic. On the other hand, more fundamental shifts, like overhauling your entire SDR outreach process, might take a full quarter to show measurable results. The key is consistent experimentation and patient measurement.
What Single Change Has the Biggest Impact on Conversion Rate?
While there's no universal silver bullet, the change that consistently delivers the biggest impact is reducing friction at the final point of conversion.
Think about that last step a prospect takes before they commit.
- For an ecommerce site, this means simplifying the checkout. That could be cutting unnecessary form fields, offering a guest checkout option, or showing all costs upfront so there are no surprises.
- In a B2B world, this might look like shortening your "Request a Demo" form from ten fields down to three or four essentials.
Addressing this final-step friction directly tackles the high cart and form abandonment rates that plague most businesses. Because you're optimizing the part of the funnel where users are most motivated, these changes often lead to the quickest and most significant conversion lifts.
Should I Focus on Optimizing for Desktop or Mobile First?
Let your own data be your guide. It's true that desktop users have historically converted at a higher rate, but mobile traffic now dominates most websites. That creates a huge opportunity gap for many companies.
Jump into your analytics and look at two key metrics side-by-side:
- Where is the majority of your traffic coming from (desktop vs. mobile)?
- Where is your conversion rate the lowest?
If you have a ton of mobile traffic but a painfully low mobile conversion rate, that’s your biggest opportunity. The ultimate goal is a seamless experience on both, but prioritizing the platform with the biggest gap between traffic and conversions will almost always give you the best initial return.
Frequently Asked Questions
What is the difference between conversion rate and win rate?
Conversion rate typically measures the percentage of visitors, leads, or prospects who complete a desired action at any stage of the funnel, such as filling out a form or booking a demo. Win rate specifically measures how often your team closes deals that have reached a final outcome, won versus lost. Conversion rate is broader and applies across marketing and sales, while win rate focuses purely on closed opportunities.
How do I improve conversion rates without increasing my budget?
Start by auditing your existing funnel for friction points using free tools like session recordings and heatmaps. Often the biggest gains come from simplifying forms, clarifying calls to action, and improving follow-up speed rather than spending more on traffic. Aligning your SDR outreach with timely buying signals also dramatically improves conversion without any additional ad spend.
Can personalization really make that big of a difference in B2B conversion rates?
Yes. Research consistently shows that 80 percent of B2B buyers are more likely to purchase when they experience tailored interactions that speak directly to their challenges. In practice, this means replacing generic sequences with trigger-based outreach that references a specific event or pain point. Teams that make this shift typically see immediate lifts in reply rates and meeting conversions.
Ready to stop guessing what your accounts are thinking and start engaging with precision? Salesmotion is the AI-powered account intelligence platform that turns market signals into your next big opportunity. Learn how our platform can help you scale personalized outreach and drive pipeline growth.