TL;DR
Stop chasing vanity metrics like lead volume. The key to predictable growth is tracking lead generation KPIs that connect marketing spend directly to revenue, such as Cost Per Lead (CPL), Customer Acquisition Cost (CAC), and Lead-to-Customer Conversion Rate. Mastering these numbers transforms your lead generation from a cost center into a reliable growth engine.
When it comes to lead generation, guessing gets you nowhere. Growing your business, on the other hand, starts with tracking the right Lead Generation Key Performance Indicators (KPIs). The real secret isn't just counting leads; it's about focusing on the metrics that reveal the true health of your entire sales funnel.
Your Quick Guide to Measuring Lead Generation Success

Don't have time to dive into the full guide right now? No problem. Here's the core takeaway.
To really get a grip on performance, you have to move beyond just counting the number of leads coming in. The smart move is to zero in on the KPIs that directly connect your marketing efforts to actual revenue. These are the numbers that tell you not just how many leads you're generating, but how much they cost and, crucially, how many of them turn into paying customers.
This kind of insight is what allows you to make smarter marketing decisions and build a predictable growth engine. If you're just starting out, here are the essential metrics to get on your dashboard:
- Cost Per Lead (CPL): This tells you exactly how efficient your marketing spend is.
- Customer Acquisition Cost (CAC): This reveals the total, all-in cost to land a new customer.
- Lead-to-Customer Conversion Rate: This shows you just how effective your sales process is at turning interest into income.
See Salesmotion in action
Take a self-guided interactive tour — no signup required.
Moving Beyond Lead Volume in B2B Sales
It’s easy to get excited when you see a spike in new leads, but focusing on volume alone is a classic B2B trap. That number is often a vanity metric. Worse, it can mask serious problems in your funnel, leading to a burnt-out sales team and tons of money wasted chasing ghosts.
Think of your lead generation key performance indicators as a GPS for your marketing efforts. A high lead count might feel like you’re flooring it, but the right KPIs make sure you're actually headed toward your real destination: revenue.
To make that shift from quantity to quality, you first have to get serious about defining what makes a lead qualified for your sales team. This simple change transforms lead generation from a cost center into a predictable revenue engine. Our guide on using ChatGPT for lead generation also digs into modern ways to boost that lead quality from the get-go.

“The talking points are gold. If they're in Salesmotion, I know they're being discussed inside that business. That makes it easy to spark a real conversation, which is 90 percent of the battle.”
Andrew Giordano
VP of Global Commercial Operations, Analytic Partners
The Foundational KPIs for Your Lead Generation Strategy

Before you can build a winning lead generation engine, you have to get the foundation right. That means knowing your numbers—the core KPIs that tell you what’s actually working.
Sure, tracking the simple Number of Leads is an obvious starting point. It gives you a quick pulse on top-of-funnel activity. But the real story, the one that gets your CFO’s attention, comes from metrics that tie your marketing spend directly to business results. These are the non-negotiables.
The first of these is Cost Per Lead (CPL). Think of it as your efficiency score. CPL tells you exactly how much cash you’re burning to get a single person to raise their hand. It’s a critical health check for any campaign.
But a cheap lead isn’t always a good lead. The ultimate measure of profitability is Customer Acquisition Cost (CAC). This is the big one. It bundles all your marketing and sales expenses to reveal the total cost of landing one new customer. Let your CAC run wild, and you can quickly find yourself upside down on every deal. Mastering this number is crucial for proving your team's ROI. You can dig deeper into essential marketing KPIs over at attention.com for a broader view.
Taken together, these foundational metrics give you a clear, honest picture of your financial performance.
Key Foundational Lead Generation KPIs at a Glance
To make this simple, here’s a quick-reference table breaking down the core KPIs we just covered. These are the metrics every B2B sales and marketing team should have on their dashboard.
| KPI | What It Measures | Why It Matters for B2B |
|---|---|---|
| Number of Leads | The total volume of new contacts entering your sales funnel. | Gauges top-of-funnel campaign reach and initial interest. |
| Cost Per Lead (CPL) | The average marketing spend required to generate one new lead. | Reveals campaign efficiency and helps optimize ad spend. |
| Customer Acquisition Cost (CAC) | The total sales and marketing cost to acquire one new customer. | The ultimate measure of profitability and long-term sustainability. |
Think of this table as your starting block. While there are dozens of other metrics you can track, these three provide the essential financial context needed to make smart decisions and build a scalable growth strategy.
Tracking Funnel Efficiency with Conversion Rate Metrics
A healthy lead generation engine isn’t just about the sheer number of leads coming in the door. It’s about how efficiently they move from one stage to the next. Tracking conversion rates at those critical handoff points is like running a diagnostic check on your funnel, showing you exactly where you have leaks that are costing you money.
This infographic breaks down the core pillars of measuring lead generation performance.
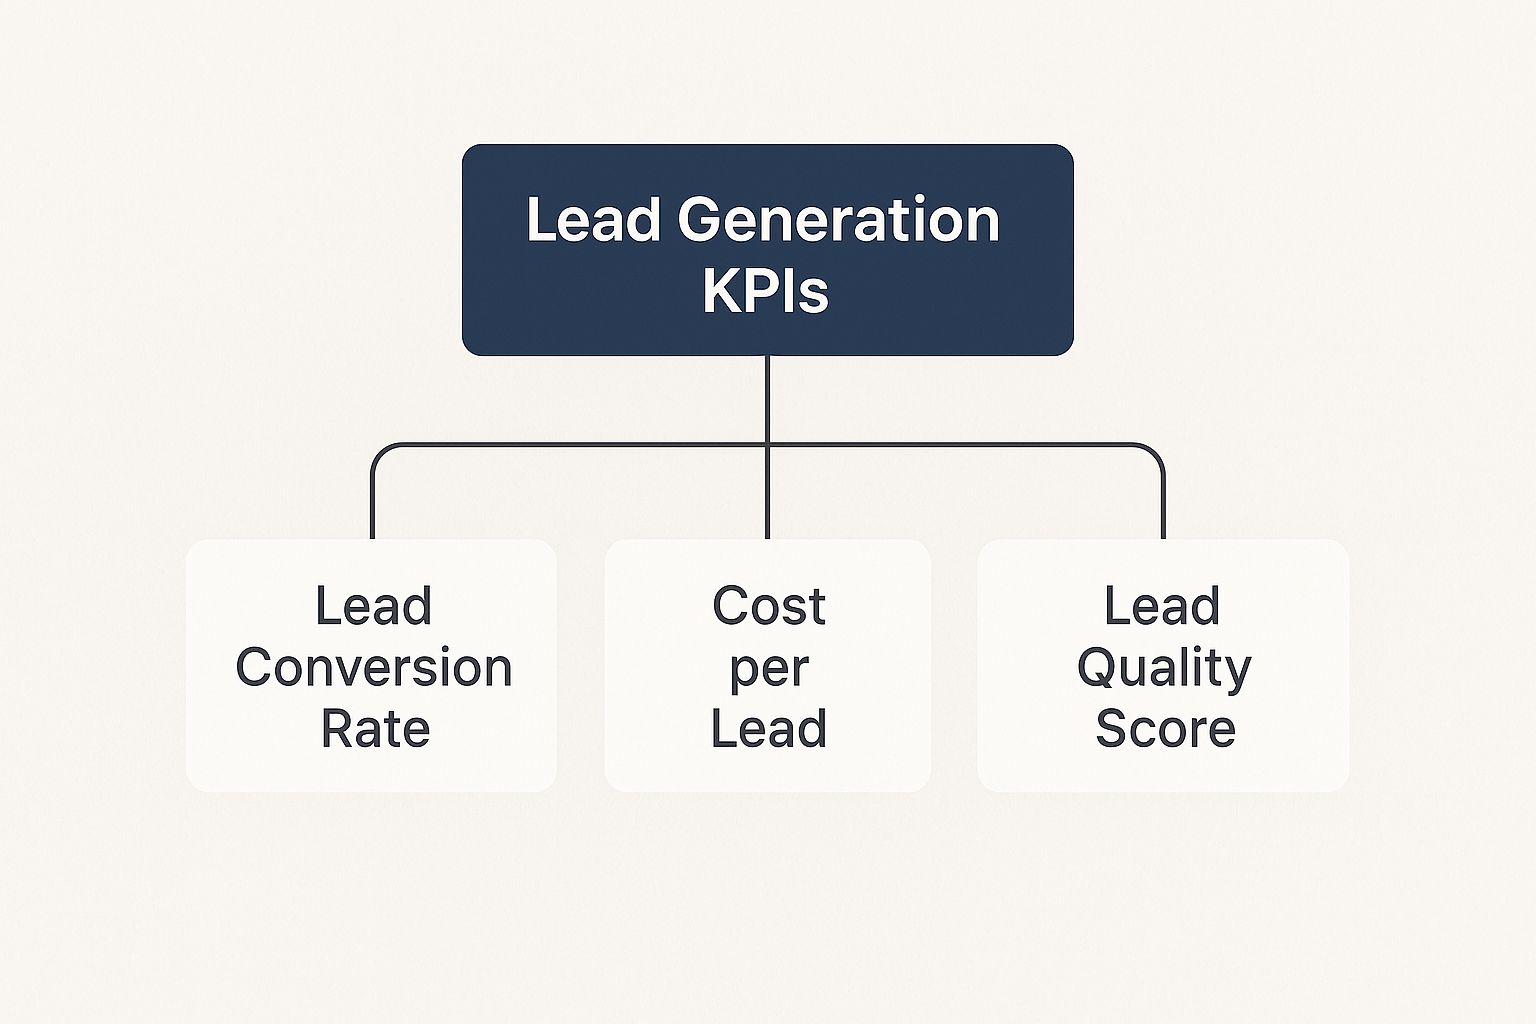
It highlights how metrics like Lead Conversion Rate, Cost per Lead, and Lead Quality Score all work together to paint a complete picture. If you really want to go deep, this complete guide to funnel analysis is a fantastic resource for optimizing your entire process.
The essential funnel metrics you absolutely have to monitor are your Visitor-to-Lead, Lead-to-MQL, and MQL-to-SQL rates. These numbers tell a story. They reveal precisely where prospects are dropping off, which allows you to reinforce specific sales pipeline stages and get the most value out of every single marketing dollar you spend.
Once you’ve got the basics down, it’s time to level up. This is where you move from just tracking what happened last month to actually predicting what will happen next quarter. Advanced lead generation KPIs are your crystal ball for forecasting revenue and growth.
Using Advanced KPIs to Predict Revenue and Growth
Think of these metrics as the gauges in a cockpit—they’re forward-looking and tell you where you’re headed, not just where you’ve been.
One of the most powerful predictors here is Lead Velocity Rate (LVR). Don't think of LVR as a snapshot; it's more like a real-time growth engine for your sales pipeline. It measures the month-over-month percentage increase in qualified leads, giving you a surprisingly reliable indicator of future sales. For most B2B SaaS companies, an LVR of 15% or higher is a strong signal that you’ve got healthy momentum. You can dive deeper into this and other key metrics in this guide to lead generation dashboards.
Another must-watch metric is Customer Lifetime Value (CLV). On its own, CLV is useful. But when you stack it up against your Customer Acquisition Cost (CAC), you get the CLV:CAC ratio—the ultimate health check for your business model.
This simple ratio tells you everything you need to know about your long-term profitability and whether your growth is actually sustainable.

“All of the vendors that I've worked with, all of the onboarding that I have had to deal with, I will say, hands down, Salesmotion was the easiest that I have had.”
Lyndsay Thomson
Head of Sales Operations, Cytel
Analyzing Your KPIs by Channel to Get Smarter with Your Marketing Spend
Let's be honest—not all lead sources are created equal. A huge wave of leads from your latest social media campaign might look impressive in a slide deck, but if none of them ever turn into actual customers, you’re just spinning your wheels and burning through cash.
To get a real grip on performance, you have to slice and dice your lead generation key performance indicators by channel. This means looking at metrics like your CPL and Conversion Rate for SEO, PPC, and email campaigns as separate buckets.
Doing this quickly shows you which channels are the hidden gems, delivering high-quality leads for pennies on the dollar, and which ones are just money pits. For a deeper look at this kind of channel-specific reporting, especially in a targeted sales environment, check out our guide on essential account-based marketing metrics.
Ultimately, this channel-by-channel view is what lets you move your marketing budget around with confidence. You can stop guessing and start doubling down on what’s actually working, fine-tuning the channels that are lagging, and getting a much healthier return on your investment. To see how top agencies build these kinds of reports, you can find more information at agencyanalytics.com.
Building Your Own Lead Generation KPI Dashboard
Tracking your lead generation key performance indicators is a great start, but let's be honest—raw data sitting in a spreadsheet doesn't help anyone. The real magic happens when you visualize those numbers in a dashboard that tells a clear, compelling story about what’s actually working.
Think of it like creating two different lenses to view your performance.
First, you need a high-level executive dashboard. This one is all about the big picture, focusing on heavy-hitters like Customer Acquisition Cost (CAC) and total pipeline generated. Its only job is to answer one critical question for leadership: "Are we growing profitably?"
Second, you build a more granular dashboard for the marketing and sales teams on the ground. This version gets into the weeds, breaking down metrics like Cost Per Lead and conversion rates by specific channels. It’s designed to pinpoint exactly which campaigns are winners and which ones are just burning cash.
Getting these two views aligned is a core pillar of a strong revenue operations function. In fact, you can learn more by exploring these detailed RevOps best practices. When done right, this approach turns your data from a confusing mess of numbers into actionable insights everyone can rally around.
Key Takeaways
- Lead volume alone is a vanity metric that can mask serious funnel problems -- the KPIs that matter are Cost Per Lead (CPL), Customer Acquisition Cost (CAC), and Lead-to-Customer Conversion Rate, which tie marketing spend directly to revenue.
- Conversion rate tracking at each funnel stage (Visitor-to-Lead, Lead-to-MQL, MQL-to-SQL) acts as a diagnostic tool, revealing exactly where prospects drop off so you can reinforce weak points and maximize every marketing dollar.
- Lead Velocity Rate (LVR) is one of the most powerful predictive metrics: a 15% or higher month-over-month increase in qualified leads signals healthy growth momentum and reliably forecasts future sales.
- The CLV:CAC ratio is the ultimate health check for your business model -- it tells you whether your growth is actually sustainable by comparing the lifetime value of a customer against the total cost to acquire them.
- Channel-by-channel KPI analysis (CPL and conversion rate for SEO, PPC, email separately) reveals which sources deliver high-quality leads affordably and which are just burning budget, enabling confident reallocation of marketing spend.
Frequently Asked Questions
What is the most important lead generation KPI?
While it’s tempting to look for one magic number, the most impactful KPI is the Lead-to-Customer Conversion Rate. It's the ultimate bottom-line metric because it tells you how effectively your entire marketing and sales process turns interest into revenue. A high rate indicates you're attracting the right kind of leads and your sales team is closing them effectively.
How often should I track lead generation KPIs?
It depends on the KPI. Top-of-funnel metrics like Number of Leads and Cost Per Lead (CPL) should be reviewed weekly to catch campaign issues early. Deeper funnel metrics like Customer Acquisition Cost (CAC) and MQL-to-SQL rates are best reviewed monthly or quarterly, as they need more time to show meaningful trends.
How do I start tracking KPIs if I have no system?
You don't need a fancy dashboard to begin. Start with a simple spreadsheet. Each month, record your total new leads, total new customers, and total marketing spend. This is all you need to calculate a basic CPL and CAC. Once you build the habit, you can graduate to more automated tools like Google Analytics.
What's a good Cost Per Lead (CPL)?
"Good" is highly relative and depends entirely on your industry, sales cycle length, and average customer value. A CPL of $200 might be a disaster for a company selling a $50/month product but an incredible bargain for a company selling enterprise software with a $100,000 price tag. The key is to measure your CPL against your Customer Lifetime Value (CLV) to ensure profitability.
Ready to stop researching and start selling? Salesmotion uses AI to monitor your target accounts for critical signals, delivering actionable insights and strategic POVs directly to your team. Save hours on prep and focus on what matters—closing deals. See how it works.