
Measuring sales productivity isn't just about counting calls and emails. It's about understanding the ratio of meaningful outputs (like revenue) to the inputs required to achieve them (time, effort, resources). It's the difference between being busy and being effective.
TL;DR: Sales productivity is Output divided by Input -- revenue generated per unit of time, effort, and cost. This guide gives you a framework for choosing the right KPIs, diagnosing where your team loses time, and making changes that turn activity into actual revenue.
The formula is simple: Productivity = Output / Input. But mastering this equation is the key to turning raw data into a real growth strategy.
Your Framework for Measuring Sales Productivity
Before you dive into CRM reports, you need a clear framework. Many teams fall into the trap of tracking everything, which leads to data overload and zero clarity. True measurement connects specific sales actions directly to revenue goals.
It's crucial to move beyond simple activity tracking. Start by understanding the distinction between tracking and measuring. Tracking tells you what happened. Measuring tells you how well it happened and why.
For example, tracking 100 calls is an input. Measuring how many meetings were booked from those 100 calls is an output. The relationship between the two is a productivity metric.
Defining Your Inputs and Outputs
First, you need to define what "input" and "output" mean for your sales process. This varies based on your business model, team structure, and sales cycle length.
-
Inputs: These are the resources your team invests—the effort. Think hours worked, calls made, emails sent, demos completed, and budget spent on tools or leads.
-
Outputs: These are the valuable results generated from those inputs. They must tie back to business goals. We’re talking about new pipeline generated, deals closed, and revenue booked.
This flow shows how inputs are converted into outputs, which is the definition of productivity.
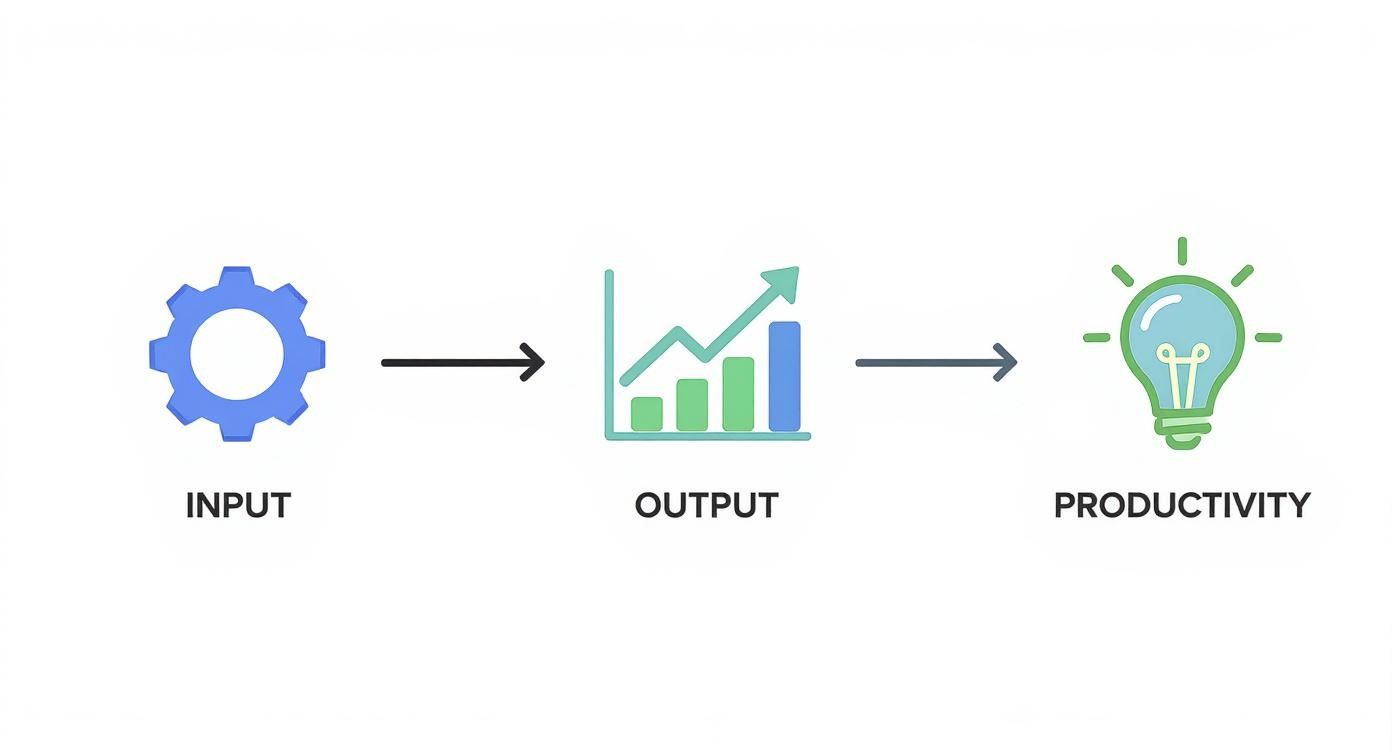 Sales productivity is the ratio of inputs to outputs -- connecting focused effort to meaningful results.
As the visual shows, productivity isn't just about the final number. It’s the result of a smart process connecting focused effort to meaningful results.
"Productivity is never an accident. It is always the result of a commitment to excellence, intelligent planning, and focused effort." – Paul J. Meyer
This commitment starts with a structured approach. A solid measurement plan is essential for any winning strategy. To see how this fits into the bigger picture, learn how to build a complete sales enablement framework that supports your reps.
The Four Pillars of Sales Productivity Metrics
To get the full picture, you can't rely on just one or two numbers. A balanced approach means looking at performance from multiple angles. This gives you a complete view of where your team is excelling and where there are opportunities to improve.
These metrics can be broken down into four key categories.
The Four Pillars of Sales Productivity Metrics
| Metric Category | What It Measures | Example KPIs |
|---|---|---|
| Activity Metrics | The volume of sales efforts. | Calls made, emails sent, demos scheduled, social touches. |
| Efficiency Metrics | The resources required to achieve an activity. | Cost per lead, time spent per deal, activities per opportunity. |
| Conversion Metrics | The effectiveness of sales efforts at each stage. | Lead-to-opportunity rate, opportunity-to-close rate, demo-to-trial rate. |
| Outcome Metrics | The final business results and revenue impact. | Quota attainment, average deal size, total revenue booked. |
By tracking KPIs across these four pillars, you move beyond surface-level stats and start to understand the why behind your numbers, which is where real coaching and improvement begin.
See Salesmotion in action
Take a self-guided interactive tour — no signup required.
Choosing KPIs That Actually Drive Revenue
Tracking every possible metric is a recipe for data overload, not insight. The key is to focus on the Key Performance Indicators (KPIs) that genuinely predict success. If you want to measure sales productivity, start by picking the right things to measure.
This isn't about chasing vanity metrics like total calls made. It’s about digging deeper to find the numbers that tell the true story of your team's effectiveness. By focusing on four essential categories—activity, efficiency, conversion, and outcome—you can build a complete picture of what's working and what isn't.
Moving Beyond Simple Activity Metrics
The most common trap is overvaluing raw activity. A rep making 200 calls a day might look busy, but if none of those calls turn into meaningful conversations, their productivity is effectively zero. The goal is to measure actions that directly move a deal forward.
Instead of just tracking volume, upgrade your activity KPIs to reflect quality.
- Calls Made vs. Meaningful Conversations: A "meaningful conversation" happens when a rep connects with a decision-maker and successfully moves the discussion to the next stage, like booking a demo.
- Emails Sent vs. Positive Reply Rate: Stop counting outbound emails. Start tracking the percentage that gets a positive response. This shows if your messaging is hitting the mark.
- Demos Scheduled vs. Demos Completed: This ratio can highlight no-show problems, pointing to potential issues in your qualification or scheduling process.
These refined metrics shift the focus from "busy work" to productive work, giving you a clearer signal of a rep's performance.
Gauging Your Team's Efficiency
Efficiency metrics tell you how much time and effort it takes to get results. They connect your team's inputs (like time) to their outputs, helping you spot bottlenecks and opportunities for coaching. Low efficiency doesn't just drain your budget; it burns out your best people.
One critical efficiency KPI is time to first contact. Research consistently shows that contacting a new lead within the first hour can boost your odds of qualifying them by 7x. Tracking this metric reveals how quickly your team acts on new interest.
Other vital efficiency KPIs include:
- Activities Per Opportunity: How many calls, emails, and meetings does it take to create one qualified opportunity? A high number might mean reps are bogged down with unqualified leads or using ineffective messaging.
- Sales Cycle Length: How long does it take for a deal to move from creation to close? Segmenting this by rep, deal size, or industry can reveal who moves deals effectively and which types of deals close fastest.
Measuring efficiency isn't about making reps work faster. It's about removing obstacles so they can spend more time on what they do best: building relationships and closing deals.
Finding Funnel Leaks with Conversion Metrics
Think of conversion metrics as the diagnostic tool for your sales funnel. They show you exactly where prospects are dropping off, letting you pinpoint specific weaknesses in your sales process. Without tracking these rates, you're flying blind, unaware of the leaks costing you revenue.
A key one to watch is the lead-to-opportunity rate. If your team generates hundreds of leads but only a tiny fraction become qualified opportunities, you likely have a lead quality problem or a breakdown in your qualification process. Our guide on lead generation key performance indicators digs deeper into measuring the top of your funnel.
When measuring sales productivity, the right KPIs are everything. For a more exhaustive list of actionable metrics, check out these 10 essential sales KPIs examples for RevOps.
Focusing on Business Impact with Outcome Metrics
Finally, outcome KPIs measure the bottom-line results of your team's work. These are the numbers your CEO and board care about because they tie directly to revenue and growth. Ultimately, they are the truest measure of sales productivity.
Key outcome metrics include:
- Quota Attainment: What percentage of your team is hitting their sales targets? It’s the most fundamental indicator of team performance.
- Average Deal Size: Are reps focused on high-value deals or closing small ones to hit activity targets? Growing this number is a powerful lever for revenue growth.
- Customer Lifetime Value (CLV): This measures the total revenue a customer generates over their relationship with your company, signaling the quality and long-term viability of the deals you're closing.
By balancing KPIs across these four categories, you create a scorecard that provides a holistic, 360-degree view of performance. This ensures you're measuring not just effort, but also efficiency, effectiveness, and business impact.

“Salesmotion helps you spot signals from prospect accounts, news items / job hiring alerts etc that indicate that now is a good time to reach out with a well-crafted message.”
Rob Douglas
Director of Sales, icit business intelligence
Using Technology to Unlock Productivity Insights
Your tech stack is the engine that powers your measurement strategy. Choosing the right KPIs is only half the battle. To truly understand sales productivity, you need data you can trust, and that comes from using technology effectively.
The right tools don't just track what your team does; they boost performance by highlighting hidden bottlenecks and automating low-value work. This frees up your sellers to focus on what matters: building relationships and closing deals.
Making Your CRM the Single Source of Truth
Your Customer Relationship Management (CRM) system must be the single source of truth for all sales data. It's non-negotiable. If reps track deals in spreadsheets or personal notes, your productivity metrics will be fragmented and useless.
Achieving this isn't about demanding CRM usage. It's about making the CRM an indispensable tool in your team's daily workflow.
- Integrate Everything: Connect your email, calendar, and calling software directly to the CRM. This automatically logs activities, eliminates manual data entry, and ensures nothing falls through the cracks.
- Keep It Simple: Overly complex CRM fields and clunky layouts create friction. Design your CRM around the key stages and data points your reps actually need.
- Enforce Data Hygiene: Set clear rules for data entry, like standardized naming conventions and consistent use of deal stages. Run regular audits to fix errors before they compromise your reporting.
When your CRM is the clean, central hub for every interaction, the data becomes a rock-solid foundation for measuring productivity.
Automating the Administrative Burden
One of the biggest drags on sales productivity is the time reps waste on non-selling activities. Sales reps spend only about 33% of their day actively selling. The rest is consumed by admin tasks, prospecting, and internal meetings. For actionable strategies to reclaim that time, see our guide on how to improve sales productivity. This is where automation and specialized tools are crucial.
Technology can slash this administrative load, giving hours back to your team each week.
- Sales Enablement Tools: These platforms centralize content like case studies, pitch decks, and email templates. Reps can quickly find the exact asset they need to move a deal forward.
- AI Forecasting Software: AI tools analyze historical data and pipeline activity to generate more accurate sales forecasts, saving managers from hours of spreadsheet work.
- Automated Prospecting and Research: Manually researching every account is a massive time sink. A modern sales intelligence platform can automate this process, delivering key insights when reps need them most.
By automating repetitive, low-value work, you give your team back their most precious resource—time to connect with customers.
The Power of a Structured Sales Process
Technology is most effective when it supports a well-defined sales process. A structured playbook acts as the backbone for your measurement strategy, creating consistency in how your team engages prospects and moves deals through the pipeline. Without it, reps are just winging it, making it impossible to compare performance or spot systemic problems.
A clear, repeatable process ensures every rep follows the same key steps, uses the same qualification criteria, and captures the same data points. This consistency allows you to measure productivity accurately across the entire team.
Market trends support this. In the U.S., 66% of sales leaders tailor their sales processes for B2B selling, and 60% use customer segmentation AI to boost efficiency. The adoption of AI-powered CRM systems also jumped from 24% in 2023 to 43% in 2024. Leaders report these tools improve productivity by automating tasks and sharpening forecast accuracy, with 51% of professionals seeing better forecasts after implementing a structured sales process.
By combining a structured sales process with the right tech, you create a powerful system for continuous improvement. You can pinpoint where deals are stalling, identify winning behaviors, and give your team the targeted coaching they need to succeed.
How to Build an Actionable Sales Dashboard
Raw data is noise. An effective sales dashboard tells a clear story about your team's performance. It turns overwhelming spreadsheets into a visual narrative that highlights wins, flags risks, and guides coaching conversations.
Building a great dashboard is how you turn measurement into actionable insight. The best dashboards are designed for a specific audience, answering the most critical questions for each role, from the CEO down to an individual sales rep.

Segment Your Data to Uncover Hidden Trends
To get real insights, you have to segment your data. Looking at team-wide totals can mask major performance differences between individuals or territories. Segmentation is key to spotting hidden patterns and understanding the why behind your numbers.
Start by breaking down your core KPIs in a few meaningful ways:
- By Individual Rep: This is your foundation for performance management. Who are your top performers, and what can others learn from them? Who is struggling, and where do they need support?
- By Team or Territory: Comparing teams helps you understand regional market differences or the impact of different managers. It can reveal which territories are overperforming and which might need more resources.
- By Customer Segment: Are you more productive selling to enterprise clients versus SMBs? This helps you align sales efforts with your most profitable customer profiles.
This level of detail moves you from broad generalizations to specific, solvable problems. It's the difference between saying "we need to improve our close rate" and knowing "our Midwest team's close rate on enterprise deals is lagging."
Choose the Right Visualizations for Your Metrics
How you display data is as important as the data itself. The right chart makes a trend obvious; the wrong one can be misleading. Your goal is clarity and immediate comprehension.
Think about the story each metric should tell.
- Trend Lines: Perfect for tracking metrics over time, like pipeline growth per quarter or monthly activities per rep. They instantly show momentum.
- Bar Charts: Ideal for comparing totals across different categories. Use them to show quota attainment by rep or deals closed by territory.
- Pie or Donut Charts: Best for showing parts of a whole, like the percentage of pipeline from different lead sources. Keep the slices to a minimum (five or less) to avoid clutter.
- Leaderboards: A simple but powerful way to visualize rep performance and spark friendly competition. They work great for activity metrics or closed-won revenue.
A well-designed dashboard shouldn't require a manual. If a user can't grasp the key takeaway from a chart in under five seconds, the visualization isn't doing its job.
Create Role-Specific Dashboard Views
Not everyone needs to see the same information. Flooding an executive with granular activity data is a waste of time, while a rep needs more than a high-level revenue number. The most actionable dashboards provide tailored views for different roles.
- Executive Dashboard: The 30,000-foot view focused on business outcomes. It should highlight KPIs like total revenue vs. target, overall pipeline health, and average deal size.
- Sales Manager Dashboard: This view is built for coaching. It needs to show team performance, quota attainment leaderboards, and conversion rates at each funnel stage.
- Sales Rep Dashboard: This should be a self-management tool. It empowers reps to track their own progress against quota, monitor their pipeline, and see their activity levels.
Automated alerts are the final piece. Set up notifications for key events, like a large deal moving to the final stage or a rep falling behind on activity goals. This proactive approach helps you address issues before they become serious problems.
It’s also crucial to remember the role technology plays. High-performing sales teams use nearly three times more sales tech than underperforming ones. In fact, organizations that effectively use their tech stack are 57% more efficient in sales development and training. Tools like a CRM, AI, and automation can free up about 20% of a sales team's time, giving them more hours for actual selling.

“Automatic account profile detail I can use to manage my territory. Using Salesmotion AI to generate value statements per persona, account, etc. Using Salesmotion to give me a starting point based on new hires, or news alerts is critical.”
Adam Wainwright
Head of Revenue, Cacheflow
Turning Your Data Into Performance Improvements
An insightful dashboard is a great start, but its real power is unlocked when you use it to drive meaningful action. This is when you shift from just measuring sales productivity to actively improving sales rep productivity. Your data becomes the launchpad for powerful coaching conversations that diagnose performance gaps and help your team win.
The goal isn't micromanagement; it's clarity. When you spot a problem on your dashboard, it’s not an accusation—it’s a question. It's your cue to dig deeper with your reps, understand the story behind the numbers, and find a solution together. This simple shift turns data into a tool for support, not surveillance.
Diagnosing Common Productivity Gaps
Your dashboard will quickly highlight common performance scenarios. The trick is to use the data to form a hypothesis, then validate it through conversation.
Take a classic example: a rep with high activity but a low conversion rate.
Imagine your rep, Alex, consistently makes 150 calls a day, but their lead-to-opportunity conversion rate is well below the team average. The dashboard has flagged the symptom. Now, it's time to diagnose the cause.
- Is it a skill gap? Perhaps Alex struggles with discovery questions. The fix is targeted coaching, maybe using call recordings to refine their technique.
- Is it a process bottleneck? Perhaps Alex is calling unqualified leads. The issue might be the quality of the leads, not their skill.
- Is it a resource issue? Does Alex have the right content, like case studies or battle cards to handle objections? A lack of materials can stall a conversation.
By using the dashboard to spot the symptom (low conversion), you can start a productive coaching conversation to uncover the root cause.
The best sales leaders don't just present the data; they use it to ask better questions. Instead of saying, "Your numbers are down," try, "I noticed your conversion rate dipped last week. What are you running into on your calls?"
This small change transforms the dynamic from a confrontation into a collaborative problem-solving session.
Optimizing How Reps Spend Their Time
One of the biggest levers for productivity is optimizing how your team spends its time. We know sellers get buried in non-selling activities. Inside sales reps spend only about 33% of their time actively selling. It's no surprise that in 2024, nearly 70% of B2B reps missed their quotas.
The good news? Companies that focus on this see real gains. In fact, 79% of sales execs say improving the productivity of existing reps is crucial for hitting targets. You can discover more sales productivity insights on SPOTIO to see the full picture.
Your dashboard can show you where selling time is disappearing. Once you pinpoint the biggest time sinks, you can roll out targeted fixes.
- Automate the admin work. Use tech to handle tasks like logging calls and updating the CRM.
- Guard their selling time. Institute "focus blocks" where internal meetings are off-limits.
- Provide better tools. Equip your team with sales intelligence and enablement platforms that simplify research.
Setting Benchmarks That Actually Motivate
Finally, use your data to set realistic and motivating benchmarks. When targets are based on historical performance, they feel achievable, not arbitrary.
Use your dashboard to establish a baseline for key metrics. From there, you can set tiered goals:
- A baseline that everyone is expected to hit.
- A target for your solid performers.
- A stretch goal for your top reps.
This approach creates a clear path for improvement and recognizes different performance levels. It ensures everyone, from your newest hire to your most seasoned veteran, knows what success looks like and has a clear target to aim for.
Key Takeaways
- Sales productivity is Output divided by Input; measuring this ratio across activity, efficiency, conversion, and outcome metrics gives you a complete picture of team effectiveness.
- Move beyond vanity metrics like raw call volume and focus on quality indicators such as meaningful conversations, positive reply rates, and lead-to-opportunity conversion rates.
- Your CRM must be the single source of truth for all sales data, with integrations that automate logging and simple layouts that minimize friction for reps.
- Segment your dashboard data by rep, territory, and customer segment to uncover hidden performance patterns that team-wide totals would mask.
- Turning data into action requires coaching conversations that diagnose root causes behind the numbers, not just surface-level performance critiques.
- Automating administrative work can reclaim roughly 20 percent of a sales team's time, freeing reps to focus on the relationship-building and selling activities that drive revenue.
Common Questions About Sales Productivity
As you begin measuring sales productivity, a few practical questions will come up. Getting ahead of them is key to building a measurement culture that sticks.
Here are the most common questions, along with straightforward answers.
What if My Team Resists Being Measured?
Reps often hear "new metrics" and think "micromanagement." The only way past this is to frame measurement as a tool for support, not surveillance.
Be transparent from day one. Explain why you're doing this—to find coaching opportunities, clear roadblocks, and help everyone close more deals. Show them how the data directly helps them.
Get buy-in by involving your team. Ask your top performers what they track to stay on pace. When the team feels a sense of ownership, they are far more likely to embrace the system.
Ultimately, your actions will speak louder than words. Once you start using data for supportive, constructive coaching, your team will see the value.
How Do I Handle Inaccurate or Incomplete Data?
The classic "garbage in, garbage out" problem. If your CRM is a mess, your dashboards are useless. The fix starts with making data entry simple for your reps.
First, audit your process. Are there too many required fields in your CRM? Are deal stages vague? Simplicity is key.
- Automate Data Entry: Integrate your email, calendar, and sales engagement tools like Outreach or Salesloft directly with your CRM. This lifts the manual burden from your reps.
- Simplify Your CRM: Get ruthless. Remove every unnecessary field and streamline layouts. Less friction means better adoption.
- Establish Clear Rules: Create a simple, one-page guide on data hygiene. Define what each deal stage means and set consistent naming conventions.
Fixing data quality isn't a one-time project; it’s an ongoing commitment. Gentle reminders and showing the team the benefits of clean data—like more accurate forecasts—will help good habits stick.
How Often Should I Review These Metrics?
The right cadence for reviewing metrics depends on the metric and the audience. Not every KPI needs daily scrutiny.
Here’s a practical rhythm that works for most teams:
- Daily: Reps should check their personal dashboards each morning for self-management, tracking activity levels and pipeline health.
- Weekly: Sales managers should review team-level metrics weekly. This is perfect for 1-on-1s, pipeline reviews, and spotting short-term trends.
- Monthly: At the end of each month, review outcome-based KPIs like quota attainment and conversion rates to track performance against targets.
- Quarterly: Take a big step back for a strategic review. Look at long-term trends, assess your sales process, and adjust your strategy for the next quarter.
This tiered approach ensures you’re having the right conversations at the right time, turning measurement into a sustainable rhythm of continuous improvement.
Frequently Asked Questions
What is the single most important sales productivity metric to track?
If you can only track one metric, focus on revenue per rep per period, as it captures the ultimate output of your sales team relative to headcount. However, this lagging indicator works best when paired with at least one leading metric, such as pipeline created per week, so you can course-correct before revenue results suffer.
How do I get meaningful data if my team has a long sales cycle?
For teams with 90-day-plus sales cycles, track leading indicators weekly, such as meetings booked, pipeline added, and stage progression velocity, rather than waiting for closed deals. Use monthly cohort analysis to measure how deals created in a given period are progressing through the funnel. This gives you actionable data well before final revenue numbers come in.
Should I compare my team's productivity to industry benchmarks or our own historical data?
Start with your own historical data as your primary benchmark because it accounts for your unique market, product, and sales motion. Industry benchmarks are useful for context and can highlight whether you are dramatically underperforming peers, but chasing someone else's numbers without understanding the differences in your business model can lead to unrealistic targets.
How do I avoid overwhelming my team with too many metrics?
Pick 3 to 5 core KPIs that span the four pillars of activity, efficiency, conversion, and outcome, and make those your team's north star. Additional metrics can be tracked by management for deeper analysis, but reps should only be held accountable to the handful that most directly influence their daily actions and pipeline outcomes.
Stop wasting hours on manual research and start having more "why now" conversations. Salesmotion uses AI to monitor your target accounts for critical buying signals and delivers actionable insights directly to your reps. See how you can save 8+ hours per week and increase pipeline by 40%. Learn more about Salesmotion and book a demo today.