Most sales reps selling into life sciences companies start their account research on Google and end up drowning in clinical trial databases, regulatory filings, and acronyms they half understand. The problem is not a lack of data. Life sciences is one of the most data-rich industries on the planet. The problem is knowing which sources matter, what to look for, and how to turn raw information into a conversation that earns a meeting.
Account research for life sciences sales requires a fundamentally different approach than researching a SaaS company or a financial services firm. The buying cycles are longer, the regulatory landscape shapes every decision, and the signals that indicate purchase readiness are buried in FDA filings, earnings transcripts, and scientific conference abstracts rather than job postings and press releases.
TL;DR: Life sciences account research demands industry-specific sources like ClinicalTrials.gov, FDA databases, and SEC filings. Build a repeatable 10-minute research framework that surfaces pipeline changes, regulatory milestones, and leadership shifts. Track the signals unique to pharma and biotech, and use the right combination of sources to walk into every call with context that earns trust.
Why Life Sciences Account Research Is Different
Selling into pharma, biotech, medical devices, and CROs is not the same as selling into other verticals. The differences go beyond terminology.
First, the buying cycles are long and committee-driven. A technology purchase at a mid-size pharma company can take 12 to 18 months and involve procurement, IT, regulatory affairs, and commercial operations. Your research needs to account for multiple stakeholders with different priorities.
Second, regulatory milestones drive budgets and timelines. An FDA approval, a clinical trial phase transition, or a Complete Response Letter can reshape a company's spending priorities overnight. Reps who track these milestones can time their outreach to moments when budgets are being reallocated and teams are scrambling to scale operations.
Third, scientific publications and conference presentations reveal strategic priorities months before press releases. A poster presentation at ASCO or a publication in The Lancet signals where a company is investing R&D resources, which therapeutic areas are gaining momentum, and which partnerships are forming.
Finally, the competitive landscape shifts with patent expirations, biosimilar entries, and licensing deals. Understanding where a company sits in its product lifecycle tells you whether they are in growth mode, defense mode, or transition.
See Salesmotion on a real account
Book a 15-minute demo and see how your team saves hours on account research.
The Key Sources to Monitor for Life Sciences Accounts
Effective account research in life sciences requires a specific set of sources that general sales intelligence tools often miss.
ClinicalTrials.gov
This is the single most valuable free resource for life sciences sales. Every interventional study conducted in the US must be registered here. You can search by sponsor, therapeutic area, phase, and status. Look for:
- New trial registrations (signals expansion into new areas)
- Phase transitions (Phase 2 to Phase 3 means major investment)
- Recruitment status changes (delays signal operational challenges)
- Terminated or withdrawn studies (signals strategic pivots)
FDA Databases
The FDA maintains several databases that reveal a company's regulatory trajectory:
- CDER Drug Approvals: Track NDAs and BLAs for upcoming approvals
- FDA Warning Letters: Compliance issues that create urgency for quality systems
- PDUFA Calendar: Scheduled action dates for pending applications (these are predictable catalysts)
- 510(k) Database: For medical device companies, cleared devices indicate product launches
SEC Filings
Publicly traded life sciences companies file quarterly and annual reports that contain intelligence you will not find anywhere else. The 10-K and 10-Q filings include risk factors, pipeline updates, collaboration revenue breakdowns, and management commentary on strategic priorities. The earnings call transcript is often the richest source. Listen for language about "commercial readiness," "launch preparations," or "scaling our field force."
PubMed and Scientific Conferences
Publications on PubMed and presentations at major conferences (ASCO, ESMO, ASH, JPM Healthcare Conference) reveal where a company's R&D investment is heading. Late-stage clinical data presentations often precede regulatory submissions by 6 to 12 months.
Industry News and Trade Publications
Sources like STAT News, Endpoints News, FiercePharma, and BioPharma Dive provide curated coverage of deals, regulatory decisions, and executive moves. These are faster than SEC filings and more digestible than raw FDA data.

“The AI templates were a surprise delight. We expected the data, but the pre-built email suggestions turned out to be much better than expected and a huge help, especially for newer reps.”
Sabina Malochleb-Bazaud
Senior Sales Operations Administrator, Cytel
The 10-Minute Research Framework for Life Sciences
You do not need to spend hours researching a single account. Here is a structured approach that delivers actionable intelligence in 10 minutes or less.
Minutes 1-3: Company Snapshot Pull up the company's investor relations page and latest earnings call transcript. Note the CEO's top three strategic priorities, any pipeline milestones mentioned, and revenue guidance. This gives you the company's own narrative about where it is heading.
Minutes 3-5: Pipeline and Regulatory Status Search ClinicalTrials.gov for the company's active trials. Identify any Phase 3 readouts, NDA/BLA submissions, or PDUFA dates in the next 6 months. Check the FDA database for recent approval actions or warning letters.
Minutes 5-7: Leadership and Organizational Changes Check LinkedIn and recent press releases for C-suite changes, new hires in key functions (commercial, medical affairs, IT, data science), and organizational restructuring. A new Chief Commercial Officer or VP of Data Science often signals a technology buying cycle.
Minutes 7-9: Competitive and Market Context Identify the company's top two competitors in their lead therapeutic area. Note any recent competitive approvals, patent expirations, or biosimilar launches that could be creating urgency.
Minutes 9-10: Synthesize Your Angle Write a one-sentence hypothesis about why this company might need your solution right now. Tie it to a specific event: an upcoming launch, a scaling challenge, a competitive threat, or a leadership change.
Teams using Salesmotion compress this entire workflow into under five minutes. The platform aggregates SEC filings, clinical trial data, leadership changes, and news into a single account brief, so reps spend time on synthesis rather than toggling between ClinicalTrials.gov, EDGAR, LinkedIn, and Google.
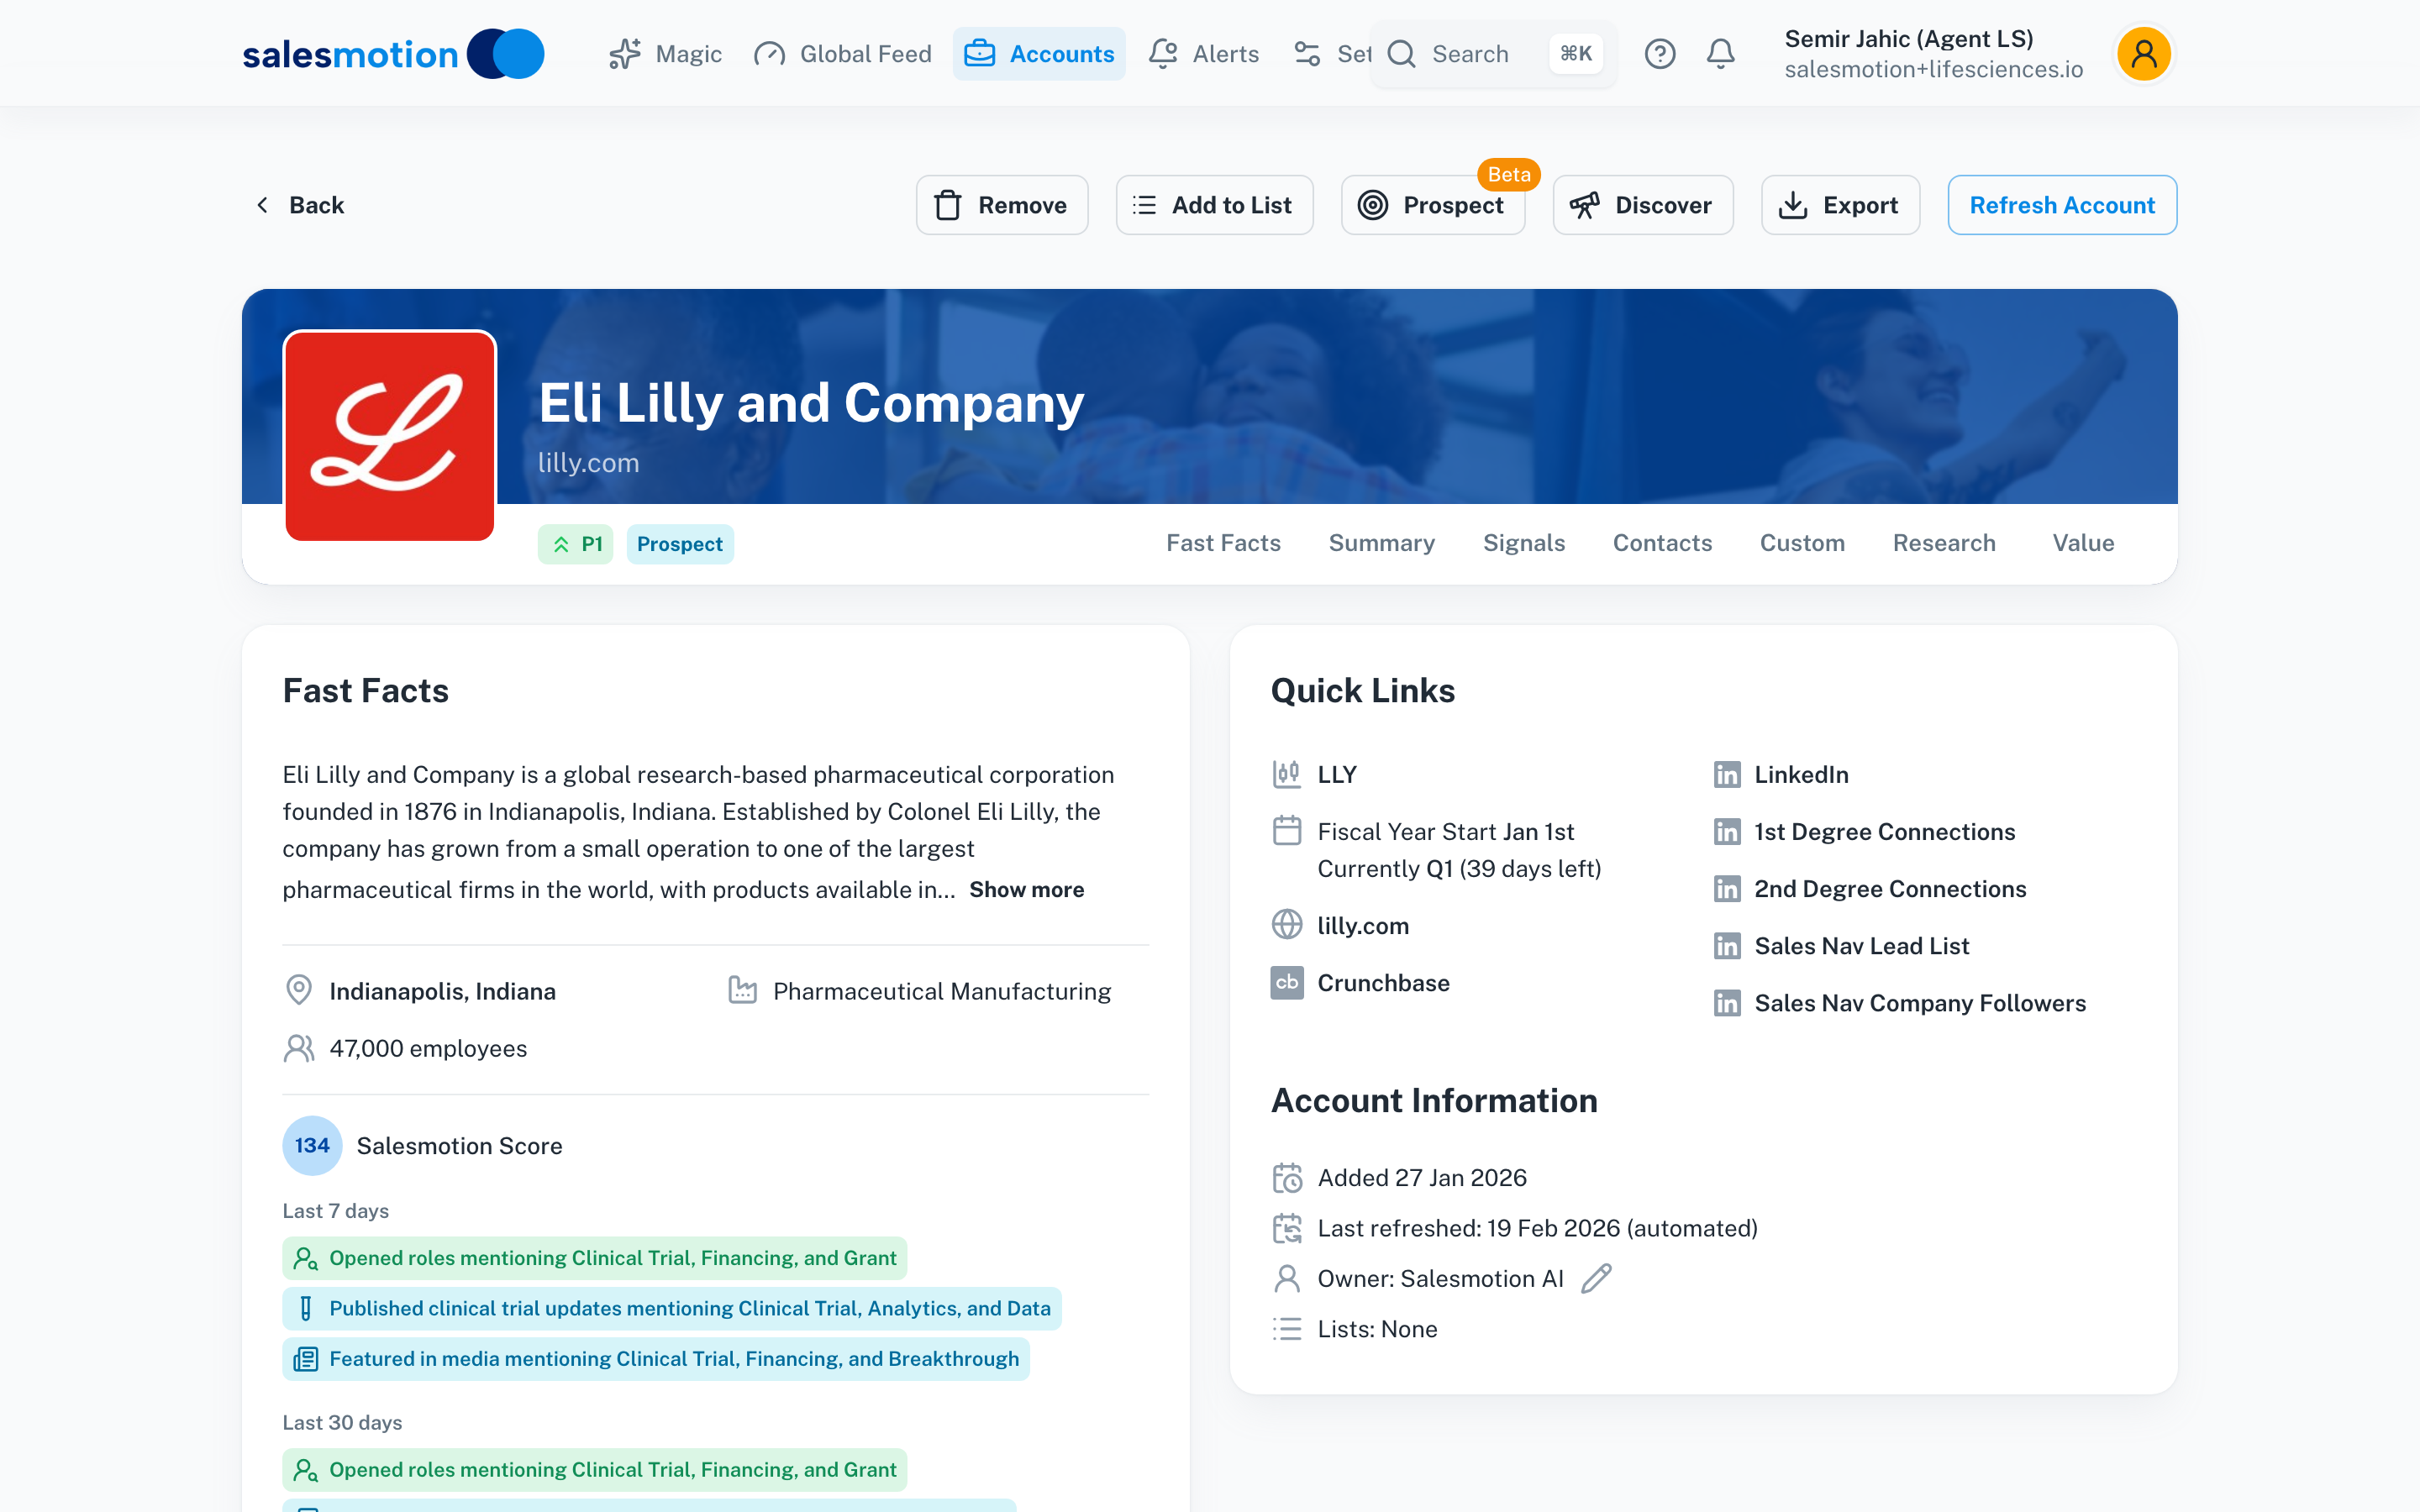 Salesmotion generates complete account briefs for life sciences companies — clinical trial activity, leadership changes, strategic priorities, and competitive intelligence — in minutes instead of hours.
Signals That Indicate Life Sciences Purchase Readiness
Not all signals carry equal weight in life sciences. Here are the buying signals that most reliably indicate a company is entering a purchasing window.
High-Priority Signals
- Phase 3 trial initiation or positive readout: This triggers commercial launch planning, which means technology purchases for field force enablement, CRM, analytics, and commercial operations.
- FDA approval or PDUFA date within 6 months: Companies preparing for launch need infrastructure. This is the highest-intent signal in pharma.
- New Chief Commercial Officer or VP of Sales: Leadership changes in commercial functions almost always lead to technology evaluations within 90 days.
- Earnings call language about "commercial readiness" or "scaling operations": Direct statements of intent to invest.
Medium-Priority Signals
- Licensing or partnership deals: Incoming assets mean new commercial capabilities are needed.
- Workforce expansion in sales or medical affairs: Job postings for field-based roles signal launch preparation.
- M&A activity: Acquisitions create integration challenges and technology consolidation opportunities.
Lower-Priority (But Still Valuable) Signals
- Conference presentations on late-stage data: Signals pipeline maturity 6 to 12 months out.
- Patent expiration timelines: Signals potential revenue declines that push companies toward operational efficiency investments.
- FDA Warning Letters: Compliance pressure that can accelerate quality system purchases.

“All of the vendors that I've worked with, all of the onboarding that I have had to deal with, I will say, hands down, Salesmotion was the easiest that I have had.”
Lyndsay Thomson
Head of Sales Operations, Cytel
Tools Comparison: Researching Life Sciences Accounts
| Approach | Coverage | Time per Account | Signal Freshness | Life Sciences Depth |
|---|---|---|---|---|
| Manual research (Google, SEC, ClinicalTrials.gov) | Comprehensive if thorough | 45-90 minutes | Real-time but labor-intensive | High, but requires expertise |
| General sales intelligence (ZoomInfo, Apollo) | Contact data, basic firmographics | 5-10 minutes | Daily to weekly | Low, no clinical/regulatory data |
| Life sciences databases (Citeline, Evaluate) | Deep pipeline and clinical data | 15-30 minutes | Weekly | Very high, but expensive and specialized |
| Salesmotion | SEC filings, news, leadership, signals | Under 5 minutes | Continuous monitoring | High for public data, integrates multiple sources |
The most effective approach combines an automated signal monitoring platform with periodic deep research using ClinicalTrials.gov and FDA databases for the accounts in your active pipeline. Cytel, a life sciences analytics company, cut their research time by 50% and consolidated five research tools into one after adopting this approach.
Connecting Research to Your Life Sciences Landing Page
For a deeper look at how sales intelligence applies to life sciences, including specific workflows for pharma, biotech, and CRO sales teams, visit our industry-specific guide. It covers how to build territory plans around clinical trial data, time outreach to regulatory milestones, and prioritize accounts based on pipeline maturity signals.
Key Takeaways
- Life sciences account research requires industry-specific sources like ClinicalTrials.gov, FDA databases, SEC filings, and scientific conference data that general sales tools miss.
- Build a repeatable 10-minute research framework: company snapshot, pipeline status, leadership changes, competitive context, and a synthesized angle.
- The highest-intent buying signals in life sciences are Phase 3 readouts, PDUFA dates, commercial leadership hires, and earnings language about launch preparation.
- Manual research delivers depth but does not scale. Combine automated account intelligence with targeted deep research on active pipeline accounts.
- Time your outreach to regulatory milestones and pipeline transitions, not arbitrary quarterly cadences.
Frequently Asked Questions
What is the best free source for life sciences account research?
ClinicalTrials.gov is the most valuable free resource. It provides detailed information on every registered clinical trial, including sponsor, phase, status, endpoints, and enrollment targets. Combined with SEC EDGAR for financial filings and PubMed for scientific publications, you can build a comprehensive account profile without paying for specialized databases.
How do you track FDA approval timelines for sales prospecting?
Monitor the PDUFA (Prescription Drug User Fee Act) calendar, which lists scheduled FDA action dates for pending drug applications. These dates are publicly available and predictable. Companies approaching a PDUFA date are actively preparing for commercial launch, making them high-intent prospects for sales enablement, analytics, and operations technology.
How often should you update your life sciences account research?
For accounts in your active pipeline, update research at least monthly, with event-driven updates for regulatory milestones, earnings releases, and leadership changes. For target accounts not yet engaged, quarterly reviews are sufficient, but set alerts for major signals like clinical trial phase transitions and FDA actions. Platforms that provide continuous monitoring eliminate the need for manual refresh cycles.
What makes life sciences sales cycles different from other industries?
Life sciences buying cycles are typically 12 to 18 months, driven by regulatory timelines, committee-based purchasing, and budget cycles tied to clinical milestones rather than fiscal quarters. Multiple stakeholders from different functions (commercial, IT, regulatory, procurement) must align. Research that maps the decision-making committee and ties your solution to a specific regulatory or pipeline milestone significantly shortens the evaluation period.