Two companies can look identical on firmographic data: same industry, same revenue, same headcount. But one runs Salesforce with Outreach and Marketo. The other runs HubSpot with no sales engagement tool. The sales conversation, competitive positioning, and integration story for each is completely different. Technographics reveal how a company operates, not just what it is, and that distinction determines whether your outreach resonates or gets ignored.
TL;DR: Technographic data shows what technology a prospect uses, from CRM and marketing automation to cloud infrastructure and security tools. Over 60% of B2B software purchases are replacement buys (Gartner), making competitive displacement the highest-value use case for technographics. Sales teams using tech stack data reduce sales cycles by 27% and improve conversion rates by 34% (HubSpot 2026). The practical applications: target accounts using competitor tools, identify integration compatibility, find technology gaps your product fills, and time outreach around contract renewal windows.
What Technographic Data Actually Covers
Technographic data maps the technology environment a company operates in. The categories most relevant for B2B sales include:
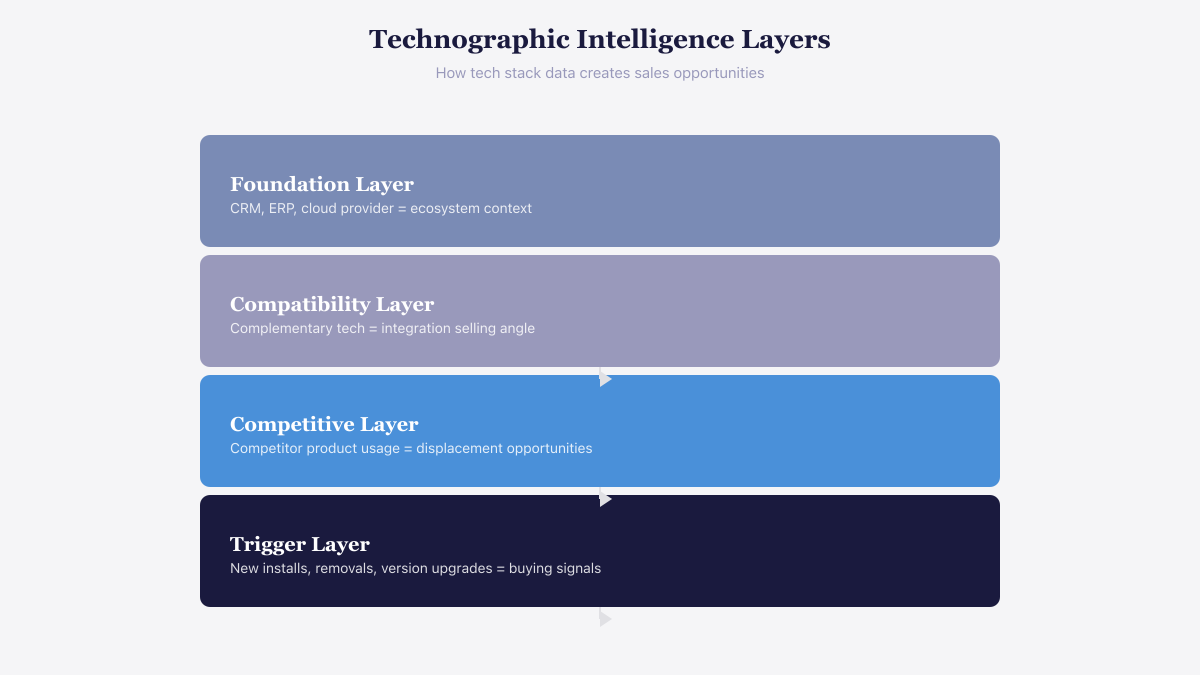 Technographic data creates sales opportunities at four distinct intelligence layers.
- CRM systems: Salesforce, HubSpot, Microsoft Dynamics, Pipedrive
- Marketing automation: Marketo, Pardot, Eloqua, ActiveCampaign
- Sales engagement: Outreach, Salesloft, Apollo
- Cloud infrastructure: AWS, Azure, Google Cloud
- Analytics and BI: Tableau, Looker, Power BI
- Security and compliance: Okta, CrowdStrike, Splunk
The average mid-market company operates with roughly 255 applications across its tech stack. That complexity creates targeting opportunities for vendors who can simplify, integrate, or replace parts of the stack.
See Salesmotion on a real account
Book a 15-minute demo and see how your team saves hours on account research.
Technographics vs. Firmographics: Different Questions, Different Answers
Firmographic data tells you what a company is: industry, revenue, headcount, location, funding stage. It answers the question "does this company match our ICP?"
Technographic data tells you how a company operates: what tools they have chosen, what gaps exist, and what competitive landscape you are entering. It answers the question "how should we approach this account?"
Both data types are necessary. Firmographics define your addressable market. Technographics prioritize and personalize within it. A practical example: firmographic filtering might identify 10,000 companies that match your ICP. Layering technographic data, filtering for companies using a specific CRM, lacking a tool in your category, or running a competitor product, can narrow that to 500 high-priority targets with a clear reason to engage.

“The Business Development team gets 80 to 90 percent of what they need in 15 minutes. That is a complete shift in how our reps work.”
Andrew Giordano
VP of Global Commercial Operations, Analytic Partners
Five High-Value Use Cases
1. Competitive Displacement
This is the highest-ROI application of technographic data. Over 60% of B2B software purchases are replacement buys, according to Gartner research. Your best prospects are not companies with no solution. They are companies with the wrong solution, one they have outgrown, or one approaching contract renewal.
When you know a prospect uses a competitor, your outreach can reference specific pain points associated with that tool, highlight migration paths, and present case studies from customers who switched. That level of specificity transforms generic cold outreach into a relevant conversation.
2. Compatibility and Integration Targeting
If your product integrates deeply with Salesforce, targeting companies already running Salesforce eliminates the compatibility objection and shortens the sales cycle. The prospect does not need to evaluate whether your tool fits their environment. It already does.
This works in reverse too. If your product does not integrate with certain platforms, technographic filtering prevents your team from pursuing accounts where technical fit is a deal-breaker, saving cycles that would end in a "no" regardless of how good the pitch is.
3. Technology Gap Identification
Some companies have a gap in their stack that your product fills. A company running paid advertising without attribution software. A sales team using CRM without account intelligence. A marketing team with email automation but no intent data.
Technographic gap analysis identifies these accounts and provides a natural conversation starter: "I noticed your team is running X and Y but does not have Z. Here is how that gap typically shows up as a problem."
4. Contract Renewal Timing
Technology adoption timelines create predictable renewal windows. If a company adopted a competitor tool 18 to 24 months ago, they are likely approaching a contract review. Reaching out during this window, when the prospect is already evaluating whether to renew, dramatically increases response rates compared to cold outreach at random timing.
Some technographic providers track adoption dates specifically to enable this timing-based targeting. Combined with intent signals showing the account is researching alternatives, renewal timing creates a high-confidence outbound trigger.
5. Personalized Multi-Stakeholder Outreach
Knowing the tech stack lets you tailor messages to different roles within the same account. The IT director cares about security and integration. The VP of Sales cares about how your tool works alongside their existing CRM and engagement platform. The CFO cares about consolidation and cost reduction.
Same product, different message for each persona, each grounded in what you know about their actual technology environment. This level of personalization is what separates account-based selling from generic outbound.
How to Collect and Evaluate Technographic Data
Five methods exist for gathering tech stack data, each with trade-offs:
Website analysis detects front-end technologies (analytics scripts, chat widgets, marketing tags) but cannot see backend or internal systems. Useful but incomplete.
Job postings reveal required technical skills that imply the tools a company uses. However, job postings lag actual adoption by months and reflect aspirational hiring, not current reality.
Third-party data providers offer the most comprehensive and current technographic data. They combine web scanning, partnership data, and proprietary detection methods to maintain databases covering thousands of technologies across millions of companies. Quality and freshness vary significantly by provider.
Intent signals show when a company is actively evaluating new technology but do not reveal their current stack. Intent data and technographic data are complementary: technographics tell you what they have, intent tells you what they are looking for.
Self-reported data from surveys or form fills is highly accurate but does not scale. Useful for enriching records on existing customers or late-stage prospects.
When evaluating technographic data providers, prioritize data accuracy and refresh frequency (monthly minimum, weekly preferred), coverage of technologies relevant to your market, integration with your CRM and sales tools, and the ability to enrich existing records rather than requiring separate workflows.
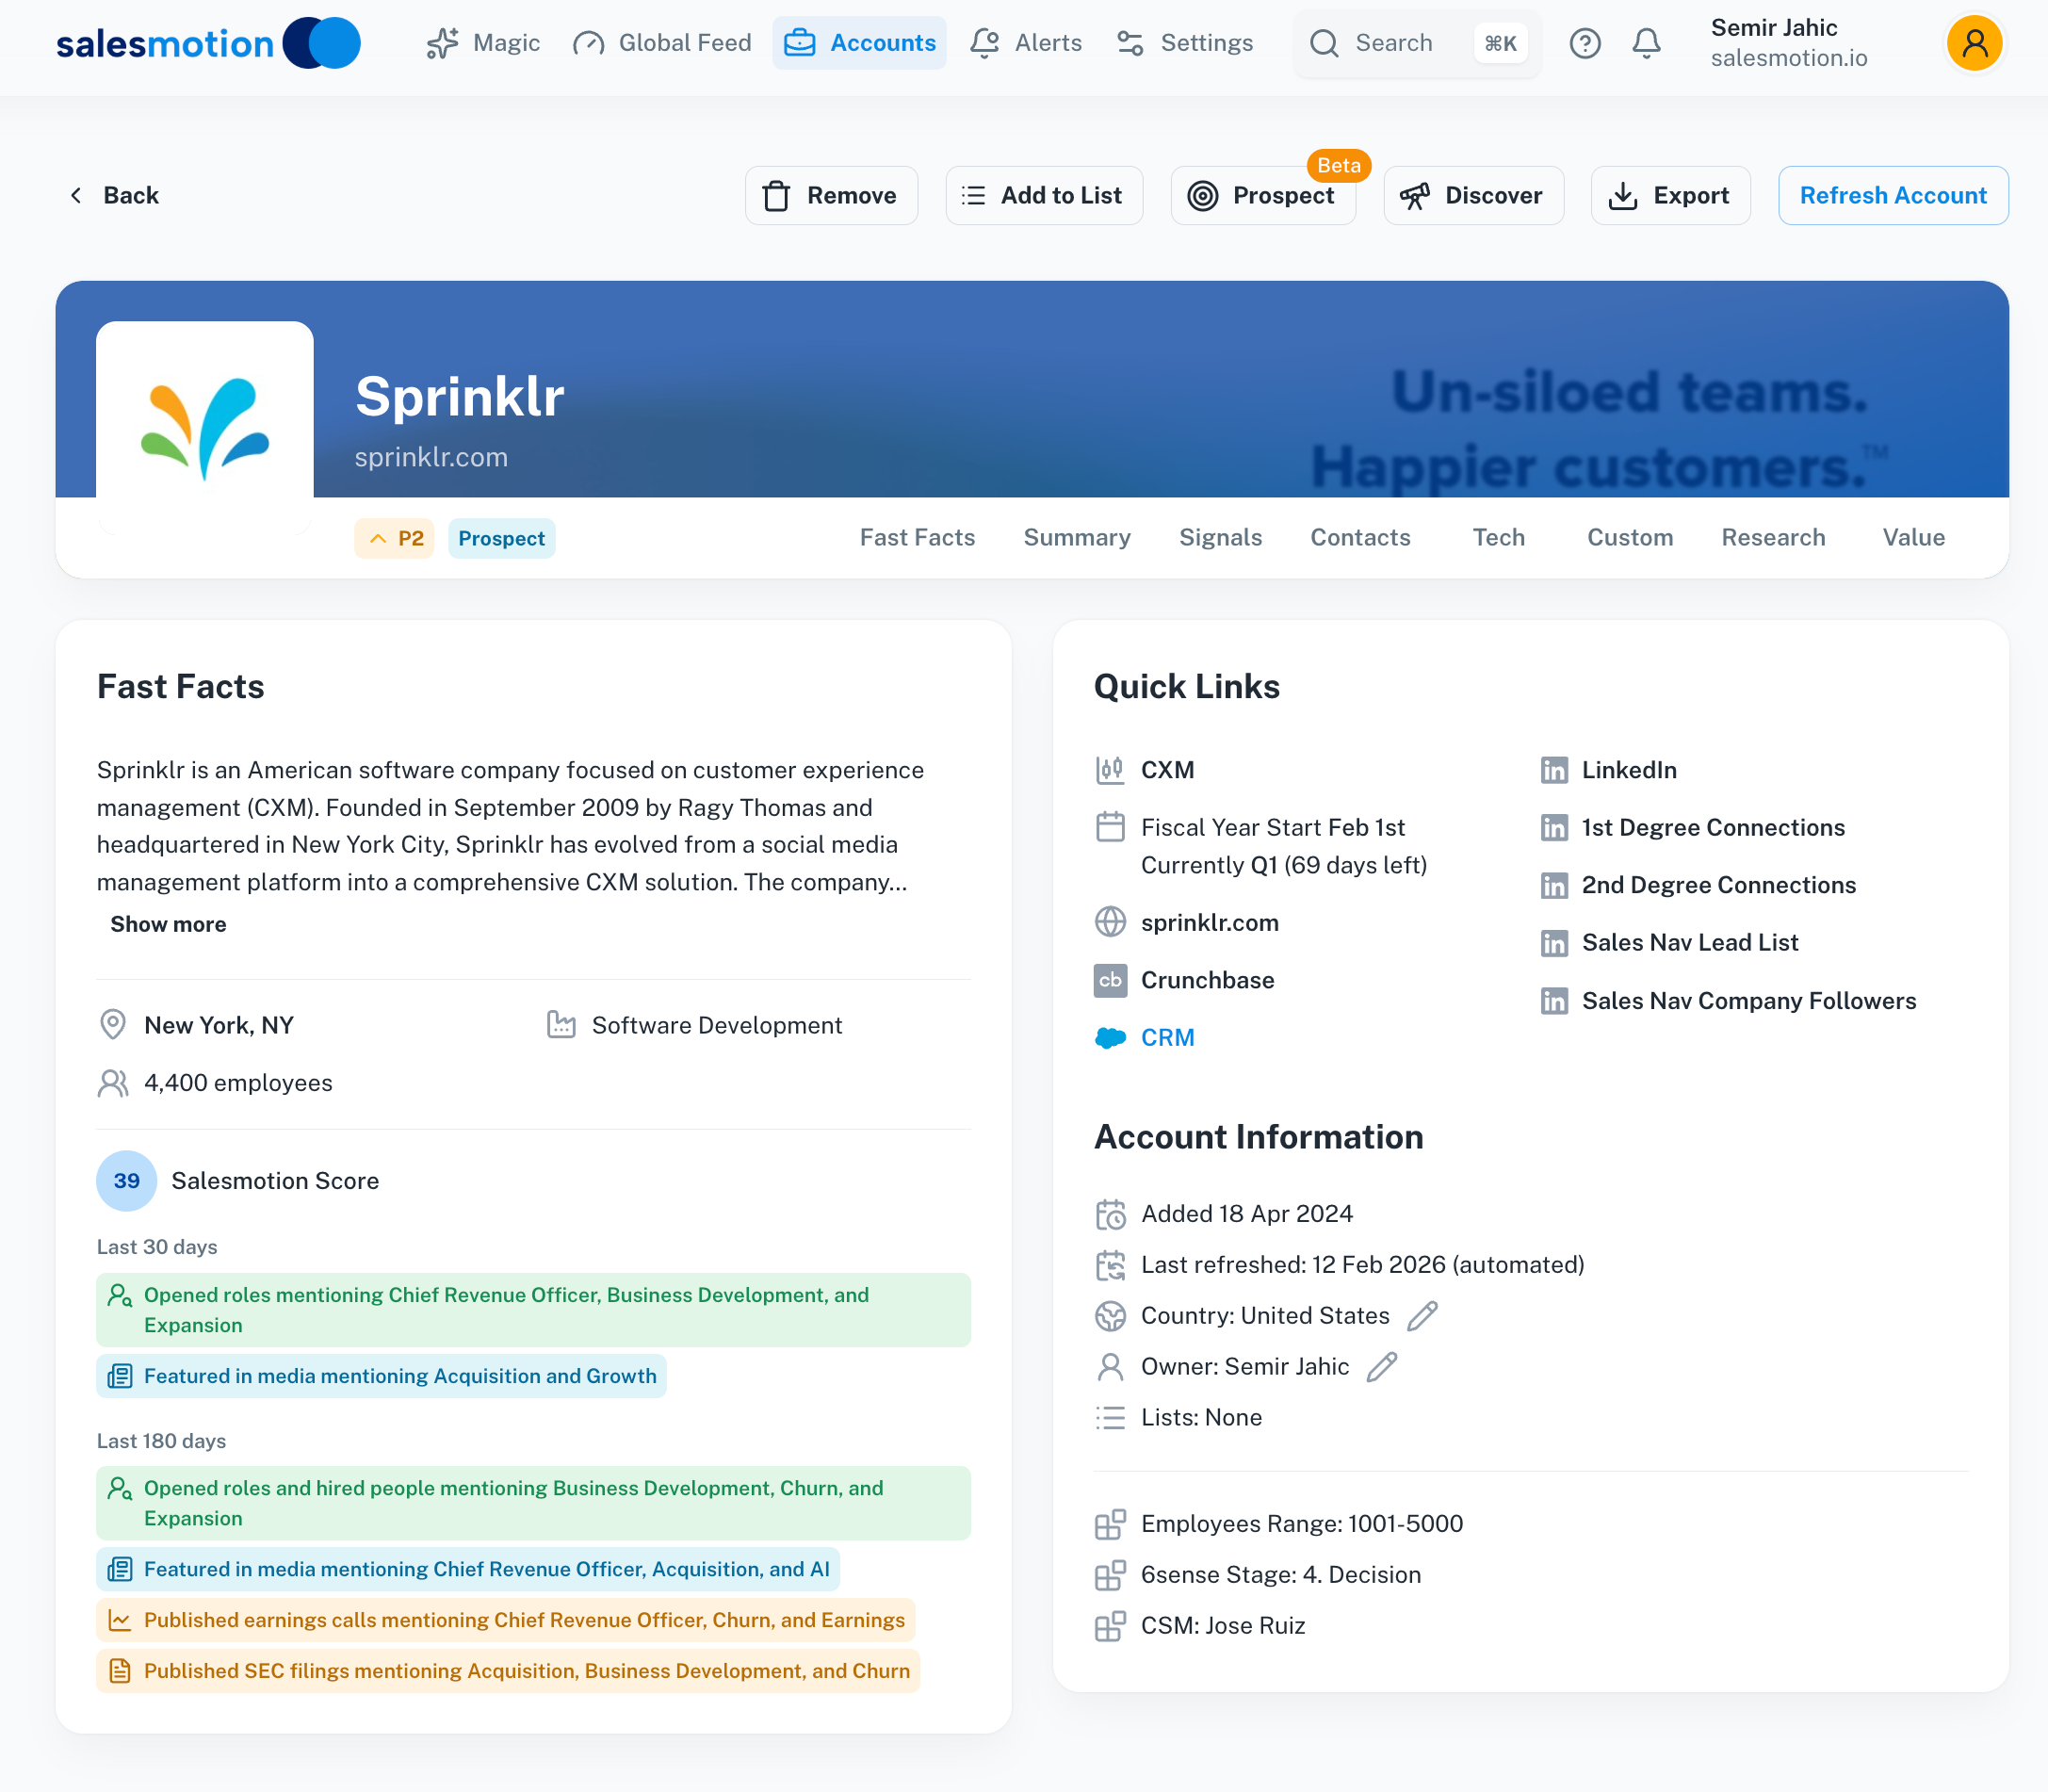 An account fast-facts panel surfaces tech stack data alongside firmographics and recent signals — giving reps the full picture before outreach.

“We're saving about 6 hours per week per seller on account research alone. That's time they can reinvest in actually selling.”
Derek Rosen
Director, Strategic Accounts, Guild Education
Key Takeaways
- Technographic data reveals how a company operates, not just what it is. It answers "how should we approach this account?" where firmographics answer "does this account match our ICP?"
- Competitive displacement is the highest-value use case. Over 60% of B2B software purchases are replacement buys.
- Sales teams using technographic data see 27% shorter sales cycles and 34% higher conversion rates.
- Use technographics for five targeting strategies: competitive displacement, compatibility targeting, gap identification, renewal timing, and personalized multi-stakeholder outreach.
- Layer technographic data on top of firmographic filtering. Firmographics define your market. Technographics prioritize within it.
- Evaluate providers on data freshness (monthly minimum), technology coverage relevant to your market, and CRM integration depth.
Frequently Asked Questions
What is the difference between technographic data and intent data?
Technographic data shows what technology a company currently uses. Intent data shows what topics or solutions a company is actively researching. They answer different questions: technographics tell you "this company uses Competitor X," while intent data tells you "this company is researching alternatives to Competitor X." Used together, they create high-confidence targeting: an account using a competitor AND actively researching replacements is the ideal prospect to prioritize.
How do you use technographics in ABM?
Technographic data sharpens ABM targeting in three ways. First, segment target accounts by tech stack fit to prioritize accounts where your product has a clear integration or displacement advantage. Second, customize ad creative and outreach messaging based on the specific tools each account uses. Third, trigger automated workflows when a target account adopts or drops a technology relevant to your solution. This level of targeting specificity is what separates effective ABM from generic outbound with a shorter list.
How accurate is technographic data?
Accuracy varies significantly by provider and detection method. Front-end technologies (website scripts, marketing tags) are detected with high accuracy because they are publicly visible. Backend systems and internally deployed tools are harder to detect and rely on inference, partnership data, or self-reported information. The best providers claim 85-95% accuracy for commonly tracked technologies, with lower accuracy for niche or internally hosted tools. Always validate a sample against known accounts before relying on a provider's data for outbound campaigns.