Biotech companies are among the most researchable prospects in any industry, and among the most frequently researched poorly. Sales reps selling into biotech default to generic company overviews and miss the clinical, regulatory, and financial signals that actually predict purchasing behavior. The irony is that biotech companies are required to disclose more about their strategic direction than almost any other type of business. Clinical trial registrations, FDA filings, patent applications, and conference abstracts collectively paint a detailed picture of where a biotech is heading, what it needs, and when it will need it.
Account research for biotech sales requires a specific skillset: reading clinical trial data for commercial implications, tracking the FDA calendar for timing signals, analyzing partnership structures for budget and capability gaps, and understanding the difference between a Phase 1 company burning cash and a Phase 3 company preparing for commercial launch.
TL;DR: Biotech account research relies on ClinicalTrials.gov, the FDA PDUFA calendar, SEC filings, scientific conference abstracts, and patent databases. Build a 10-minute framework that identifies pipeline maturity, regulatory milestones, partnership dynamics, and capital position. The strongest buying signals are Phase 3 data readouts, PDUFA dates within 6 months, commercial leadership hires, and partnership announcements that signal capability building.
Why Biotech Account Research Is Different from General Life Sciences
While biotech overlaps with broader life sciences, several factors make it a distinct research challenge.
Pipeline stage determines everything. A pre-clinical biotech company has completely different needs than a company with a product approaching FDA approval. Pre-clinical companies are focused on research tools and R&D infrastructure. Companies in late-stage trials are building commercial capabilities: field force, market access, distribution, analytics, and CRM. Your research needs to accurately identify where the company sits in this spectrum.
Cash runway shapes urgency. Most biotech companies are pre-revenue and funded by venture capital or public market financing. Their cash position determines how aggressively they can invest. A biotech with 36 months of cash runway after a recent IPO is in a different buying mode than one with 12 months of runway seeking a bridge financing. SEC filings disclose cash balances and burn rates explicitly.
Partnerships reveal capability gaps. Biotech companies frequently enter partnerships with larger pharma companies for development, manufacturing, and commercialization. The structure of these partnerships reveals what the biotech can do internally versus what it needs external help with. A biotech that partnered out US commercialization rights is not buying sales technology for that asset. One that retained commercial rights is.
Conference presentations are forward-looking indicators. Data presentations at ASCO, ASH, AACR, ESMO, and JPM Healthcare Conference reveal pipeline progress months before regulatory filings. A late-breaking abstract presentation at ASCO with positive Phase 2 data predicts a Phase 3 trial launch, which predicts commercial preparation activities 18 to 24 months later.
See Salesmotion on a real account
Book a 15-minute demo and see how your team saves hours on account research.
The Key Sources to Monitor for Biotech Accounts
Effective account research in biotech requires mastering a small number of high-value sources.
ClinicalTrials.gov
The foundational source for biotech research. Every US clinical trial must be registered. For biotech-specific research, focus on:
- Trial phase and status: Phase 3 active trials indicate late-stage investment. New Phase 1 trials indicate early R&D expansion.
- Primary endpoints and trial design: Tells you what the company is trying to prove and how confident they are.
- Enrollment targets and sites: Larger trials with more sites indicate bigger investment and higher commercial expectations.
- Estimated completion dates: Tells you when data readouts will occur and when the commercial preparation window opens.
FDA PDUFA Calendar
The Prescription Drug User Fee Act (PDUFA) calendar lists scheduled FDA action dates for pending applications. These dates are the most predictable catalysts in biotech:
- Companies approaching a PDUFA date are in active launch preparation
- A PDUFA date within 6 months means commercial infrastructure decisions are being made right now
- Accelerated approval pathways (breakthrough therapy, priority review) compress timelines further
SEC Filings
Biotech SEC filings are unusually detailed because the business is the pipeline. Key data includes:
- Cash position and burn rate: Tells you how long the company can operate and how aggressive it can be with spending
- Collaboration and licensing agreements: Detailed in the 10-K, these reveal partnership structures, milestone payments, and commercialization rights
- Risk factor disclosures: Specific risks mentioned tell you exactly what challenges the company is focused on
- Earnings call transcripts: CEOs of biotech companies discuss pipeline strategy, partnership decisions, and capital allocation with unusual specificity
Conference Abstracts and Presentations
Major medical conferences are where biotech companies present clinical data that shapes their strategic direction:
- ASCO (oncology), ASH (hematology), AACR (cancer research)
- JPM Healthcare Conference (January, the most important business strategy conference in biotech)
- Late-breaking abstracts indicate high-impact data
- Poster presentations signal earlier-stage pipeline activity
Patent Databases
Google Patents and the USPTO reveal R&D investment direction:
- New patent filings indicate therapeutic area expansion
- Patent expiration dates signal lifecycle management challenges
- Patent litigation reveals competitive dynamics

“The AI templates were a surprise delight. We expected the data, but the pre-built email suggestions turned out to be much better than expected and a huge help, especially for newer reps.”
Sabina Malochleb-Bazaud
Senior Sales Operations Administrator, Cytel
The 10-Minute Research Framework for Biotech
Minutes 1-3: Company Profile and Pipeline Overview Identify the company's stage (pre-clinical, clinical, commercial), therapeutic focus areas, and pipeline breadth. Check the company's pipeline page on their website. Note the most advanced asset and its current phase.
Minutes 3-5: Clinical and Regulatory Milestones Search ClinicalTrials.gov for active trials, noting phases and estimated completion dates. Check the PDUFA calendar for any pending FDA dates. Look for recent data presentations at conferences.
Minutes 5-7: Financial Position and Partnership Structure Review the latest 10-Q or 10-K for cash position, burn rate, and runway. Check for recent financing events (IPO, secondary offering, debt facility). Review partnership agreements for commercialization rights and milestone structures.
Minutes 7-9: Commercial Readiness and Organizational Signals Check LinkedIn and press releases for commercial leadership hires (VP of Commercial, Head of Market Access, VP of Sales). Look for job postings that signal launch preparation: medical science liaisons, field sales, market access, and commercial operations roles.
Minutes 9-10: Synthesize Your Angle Connect a pipeline milestone to a commercial capability need. "Your lead oncology asset has a PDUFA date in Q3, and you just posted 15 commercial operations roles. Here is how we help biotech companies scaling their commercial infrastructure for a first launch" is a conversation that earns time.
Salesmotion pulls SEC filings, leadership changes, earnings data, and news into a single account brief. For biotech sales, this means reps can monitor their territory for the financial and organizational signals that indicate commercial preparation without manually tracking dozens of companies across ClinicalTrials.gov, EDGAR, and LinkedIn. Cytel, a biotech analytics company, consolidated five research tools into one and cut their account planning time by 30% with this approach.
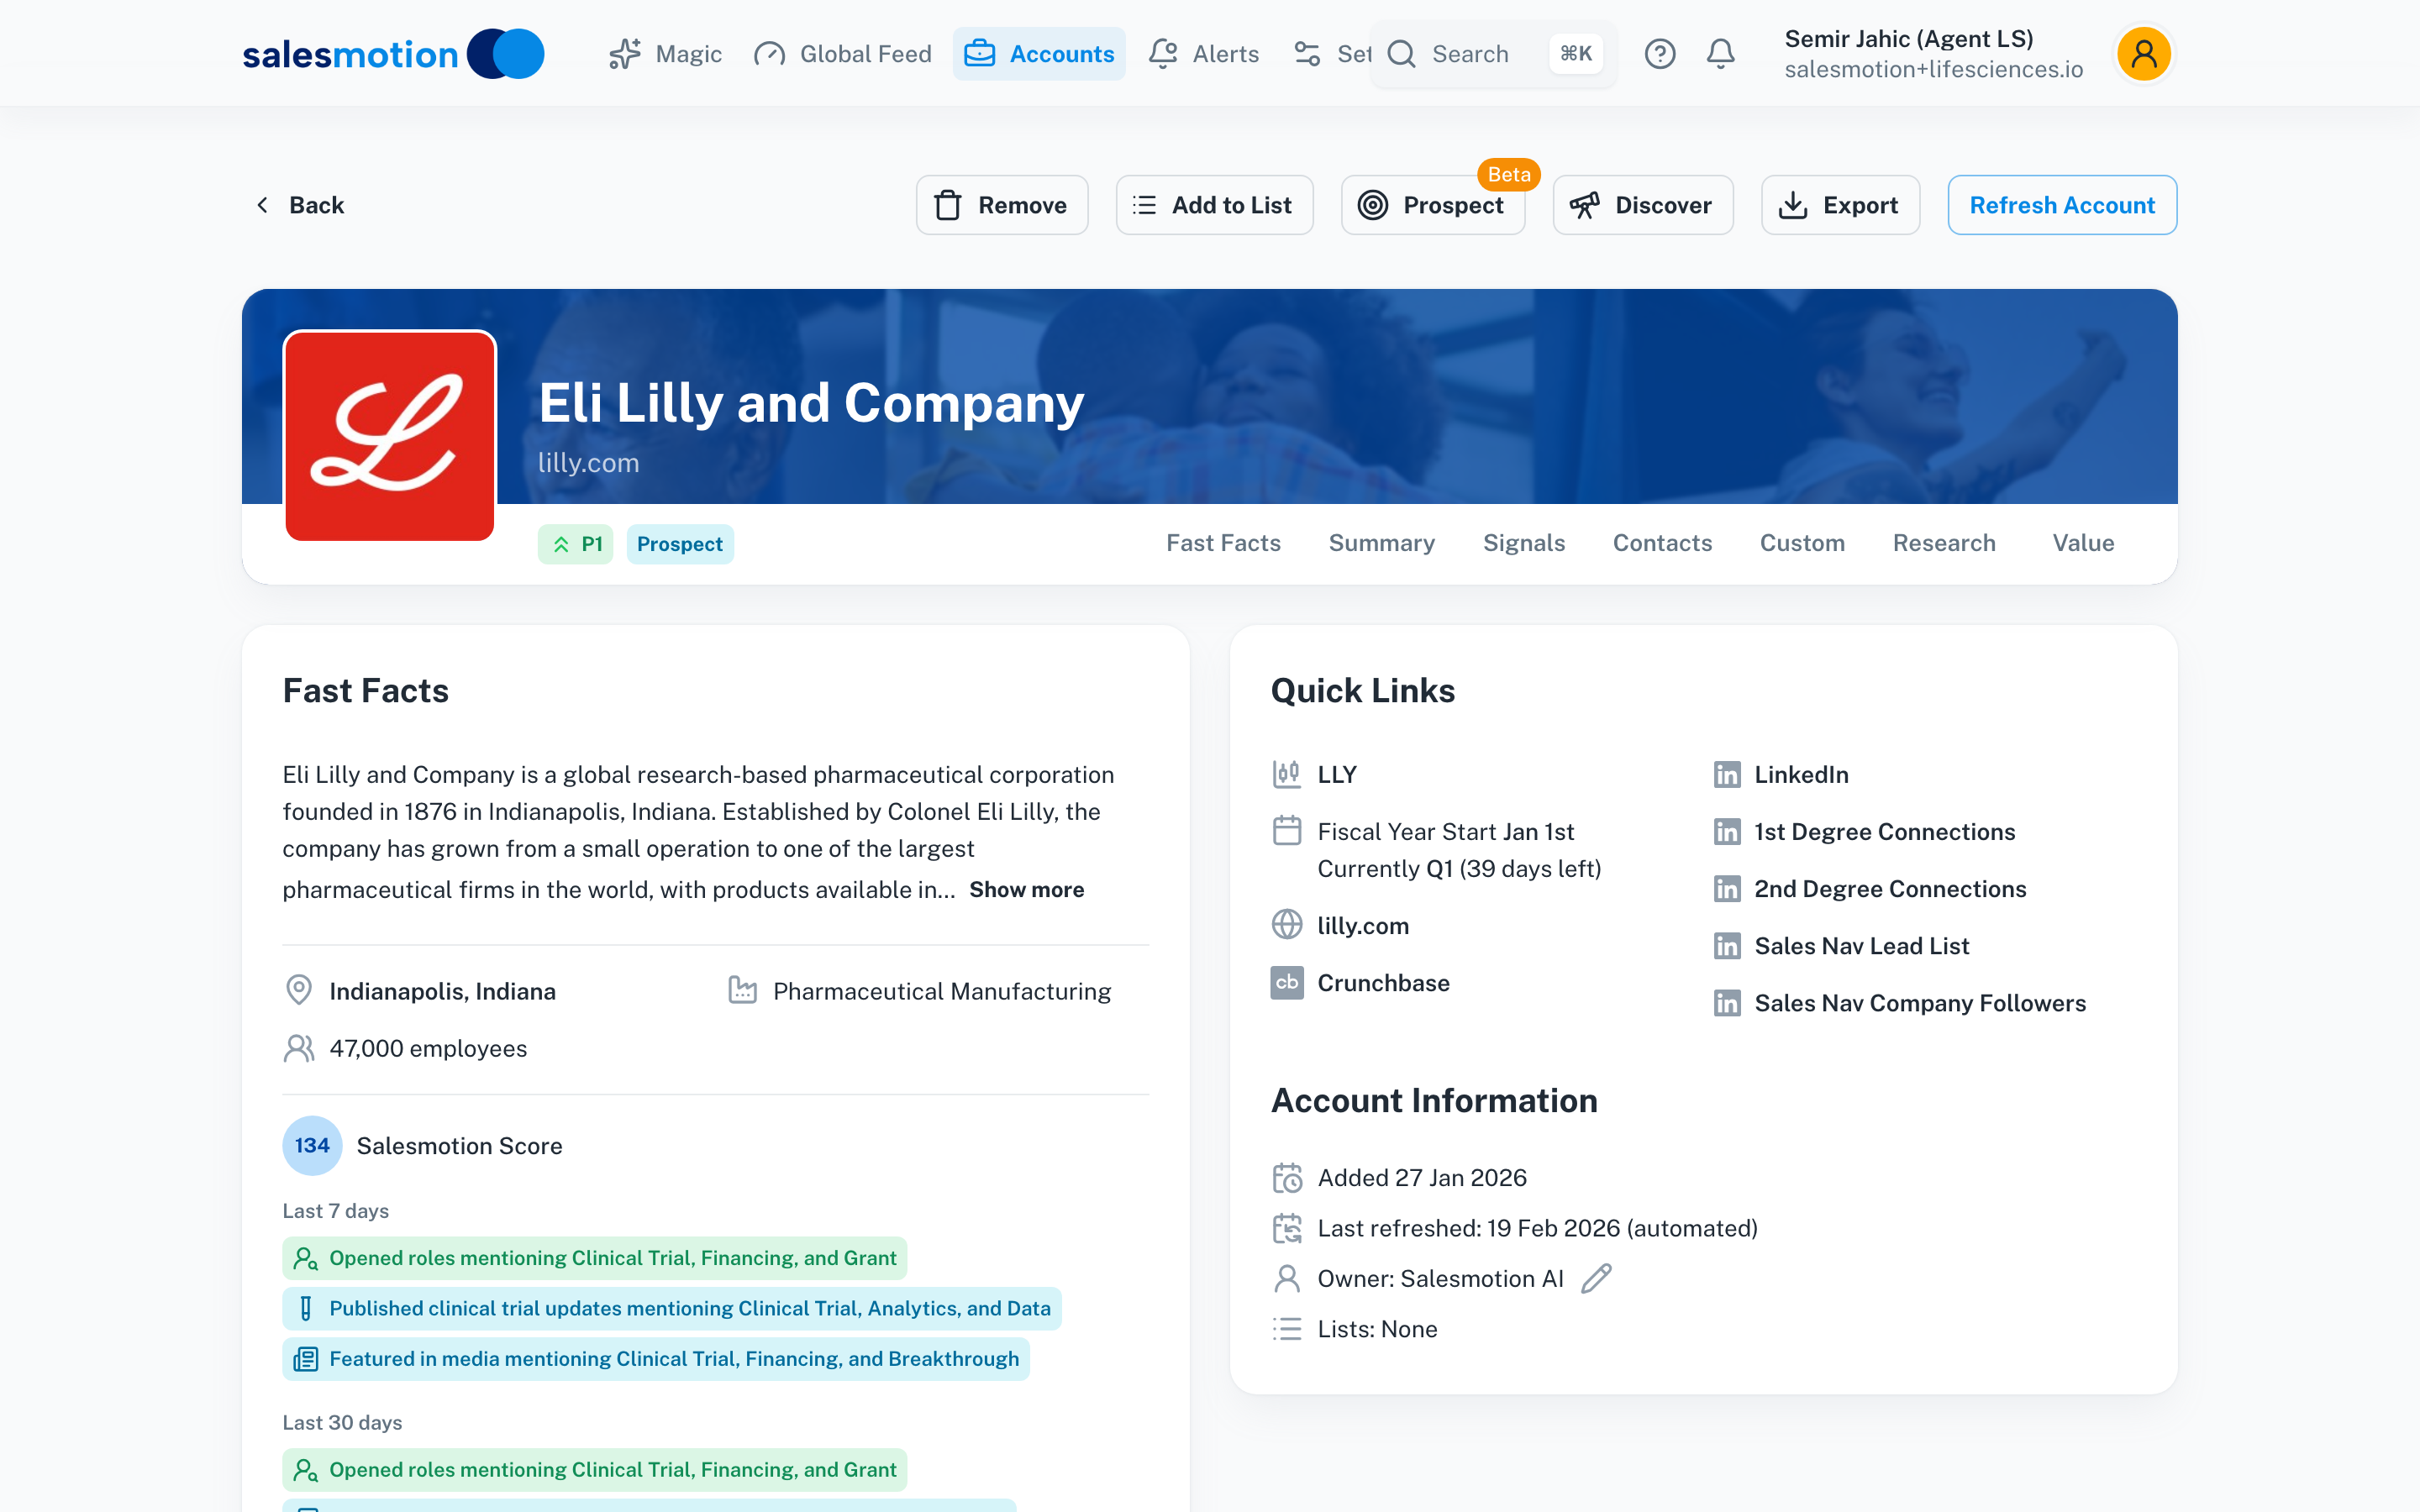 Salesmotion generates complete account briefs for life sciences companies — clinical trial activity, leadership changes, strategic priorities, and competitive intelligence — in minutes instead of hours.
Signals That Indicate Biotech Purchase Readiness
The buying signals in biotech are highly specific and tied to clinical, regulatory, and financial milestones.
High-Intent Signals
- PDUFA date within 6 months: The strongest signal. Companies prepare commercial infrastructure 6 to 12 months before an expected approval.
- Positive Phase 3 data readout: Triggers NDA/BLA submission planning and commercial capability building.
- VP of Commercial or Head of Sales hire: Signals that the company is building commercial capabilities for an upcoming launch.
- IPO or major financing event: Fresh capital enables infrastructure investment. Post-IPO biotechs often make their first significant technology purchases.
Medium-Intent Signals
- Partnership announcement with commercialization component: Signals that the company is planning for market entry and needs supporting infrastructure.
- Expansion into new therapeutic areas: New trials in different indications signal pipeline diversification and potential R&D tool needs.
- Commercial operations job postings (MSLs, market access, sales ops): Confirms launch preparation is actively underway.
Lower-Intent (Longer-Term) Signals
- Phase 1 or Phase 2 trial initiation: Signals R&D investment direction 3 to 5 years ahead of commercial needs.
- Patent filing in new modalities: Indicates long-term R&D direction.
- Conference abstract accepted for poster presentation: Early-stage data that signals pipeline activity.

“All of the vendors that I've worked with, all of the onboarding that I have had to deal with, I will say, hands down, Salesmotion was the easiest that I have had.”
Lyndsay Thomson
Head of Sales Operations, Cytel
Tools Comparison: Researching Biotech Accounts
| Approach | Coverage | Time per Account | Signal Freshness | Biotech Depth |
|---|---|---|---|---|
| Manual (ClinicalTrials.gov, SEC, FDA, PubMed) | Very comprehensive | 60-90 minutes | Real-time | Very high |
| General sales intelligence (ZoomInfo, LinkedIn) | Contact data, firmographics | 5-10 minutes | Daily | Low, misses pipeline data |
| Biotech databases (Evaluate, Citeline, Cortellis) | Deep pipeline and financial data | 15-30 minutes | Weekly | Very high, but expensive |
| Salesmotion | SEC, leadership, news, strategic signals | Under 5 minutes | Continuous | High for public intelligence |
The most effective approach combines automated signal monitoring for leadership changes, earnings events, and news across your territory with targeted deep research using ClinicalTrials.gov, FDA databases, and conference abstracts for your highest-priority accounts.
For the complete guide to sales intelligence for biotech, including workflows for selling to pre-commercial, launching, and commercial-stage biotech companies, explore our industry resource.
Key Takeaways
- Biotech account research requires ClinicalTrials.gov, FDA PDUFA calendar, SEC filings, conference abstracts, and patent databases that general sales tools completely miss.
- Pipeline stage determines purchasing behavior. Pre-clinical companies buy R&D tools. Late-stage companies buy commercial infrastructure. Know the difference before you pitch.
- Cash position and burn rate shape buying urgency. SEC filings disclose this explicitly for every public biotech.
- PDUFA dates are the most predictable catalyst in biotech sales. Companies approaching an FDA decision date are actively building the commercial capabilities they will need post-approval.
- Partnership structures reveal what a biotech does internally versus externally. Research commercialization rights before assuming a company is building its own sales force.
- Layer automated account intelligence for territory monitoring with targeted clinical and regulatory research on active pipeline accounts.
Frequently Asked Questions
What is the PDUFA calendar and why does it matter for biotech sales?
The Prescription Drug User Fee Act (PDUFA) establishes deadlines by which the FDA must act on drug applications. These action dates are publicly posted and highly predictable. For sales teams, a PDUFA date within 6 to 12 months is the strongest buying signal in biotech because companies must have their commercial infrastructure in place before an approval. This includes field sales technology, CRM, market access platforms, analytics, and commercial operations tools. Monitor PDUFA dates through the FDA website and biotech news services.
How do you assess a biotech company's ability to buy based on their financial position?
Check the company's most recent 10-Q filing for cash, cash equivalents, and short-term investments. Compare this against their quarterly cash burn rate (operating expenses minus revenue, if any). A company with 18+ months of cash runway has financial flexibility. A company with under 12 months of runway is in conservation mode and less likely to make discretionary technology purchases. Recent financing events (IPO, secondary offering, debt facility) signal fresh capital availability. Milestone payments from partnerships also contribute to purchasing capacity.
How do conference abstracts predict biotech purchasing behavior?
Late-breaking abstract presentations at major conferences (ASCO, ASH, AACR) indicate high-impact clinical data. Positive data presentations typically precede regulatory submissions by 6 to 12 months, which means commercial preparation activities begin shortly after. Tracking which companies have abstracts accepted at upcoming conferences gives you 3 to 6 months of advance notice before the data becomes widely known. JPM Healthcare Conference presentations in January are particularly valuable because CEOs explicitly discuss commercial strategy and spending plans for the year ahead.
What is the difference between researching biotech versus big pharma accounts?
Biotech companies are typically focused on a narrow set of therapeutic areas with a concentrated pipeline. Their entire business strategy is visible through ClinicalTrials.gov and SEC filings. Big pharma companies have diverse portfolios across many therapeutic areas, and purchasing decisions are decentralized across business units. Biotech research should focus on pipeline milestones, cash position, and commercial readiness signals. Big pharma research should focus on earnings commentary about specific therapeutic areas, organizational changes within business units, and strategic initiative announcements. The research sources overlap, but the analysis framework is different.