Manual account research looks harmless because it sits inside normal sales work. A rep checks LinkedIn, opens a press release, scans an earnings transcript, updates the CRM, and moves on. Nobody opens a budget line called “research tax,” so the cost stays buried.
That's a mistake. One industry benchmark says enterprise reps spend 6+ hours per week on manual account research, which works out to about 312 hours per rep per year and roughly $15,000 to $22,000 in direct compensation per rep annually before opportunity cost when you run the math using loaded rep cost, as outlined in Salesmotion's breakdown of manual account research cost.
For a CRO, that changes the conversation. This isn't a workflow preference. It's a budget issue, a capacity issue, a pipeline issue, and eventually a scale issue.
The Hidden Tax on Your Sales Team
The cost of manual account research doesn't show up in one place. It leaks across the quarter in small chunks of rep time, delayed follow-up, uneven prep quality, and accounts that never get touched with enough depth.
That's why teams underestimate it. They treat research as part of the job, which it is. But they don't separate useful strategic thinking from repetitive manual collection work. Those are different activities with different economics.
A rep should spend time deciding how to approach an account. A rep shouldn't spend large amounts of time hunting through scattered public sources, copying notes into a CRM, checking whether data is stale, and repeating the same process next week.
The practical problem is that manual research creates four costs at once:
- Direct labor cost: You're paying expensive revenue talent to do administrative gathering work.
- Opportunity cost: Every research hour is an hour not spent on prospecting, follow-up, qualification, or deal movement.
- Quality cost: One rep writes a strong brief. Another skims a profile and guesses. Process quality becomes inconsistent by person.
- Scale cost: More accounts mean more hours. Manual research expands in a straight line with volume.
If you want a useful gut check on how much time this consumes in the field, this look at how much time reps spend researching is a good starting point for framing the issue internally.
Manual research feels free because it uses people you already employ. It isn't free. It's one of the easiest places for labor cost to hide inside the sales org.
The biggest mistake I see in RevOps discussions is stopping at “our reps need better prep.” Better prep matters. But the business case gets stronger when you ask a harder question: What is this prep method costing us every year?
See Salesmotion in action
Take a self-guided interactive tour — no signup required.
Calculate Your Direct Labor Cost
Start with the easiest number to defend. Direct labor cost.
This is the floor, not the ceiling. It tells you what you already spend paying reps to do manual research work before you even talk about lost pipeline.
Use the basic formula
The cleanest model is:
Annual direct labor cost = number of reps × research hours per week × selling weeks per year × fully loaded hourly rate
If you want a quick benchmark, one industry reference says enterprise reps spend 6+ hours per week on manual account research, equal to 312 hours per rep per year and about $15,000 to $22,000 in direct compensation per rep annually before opportunity cost, according to this benchmark on the real cost of manual account research.
That benchmark gives you a credible outside reference. Your internal model should still use your own team's numbers.
What counts in a loaded hourly rate
Don't use base salary alone. For decision-making, use a fully loaded hourly cost. That usually includes:
- Cash compensation such as salary and variable pay expectation
- Benefits and payroll burden such as healthcare, taxes, and employer contributions
- Management overhead tied to supporting the rep
- Tools and enablement cost if you want a stricter internal model
A loaded hourly rate is always higher than the wage number people use in casual conversations. That's why manual work looks cheaper on paper than it really is.
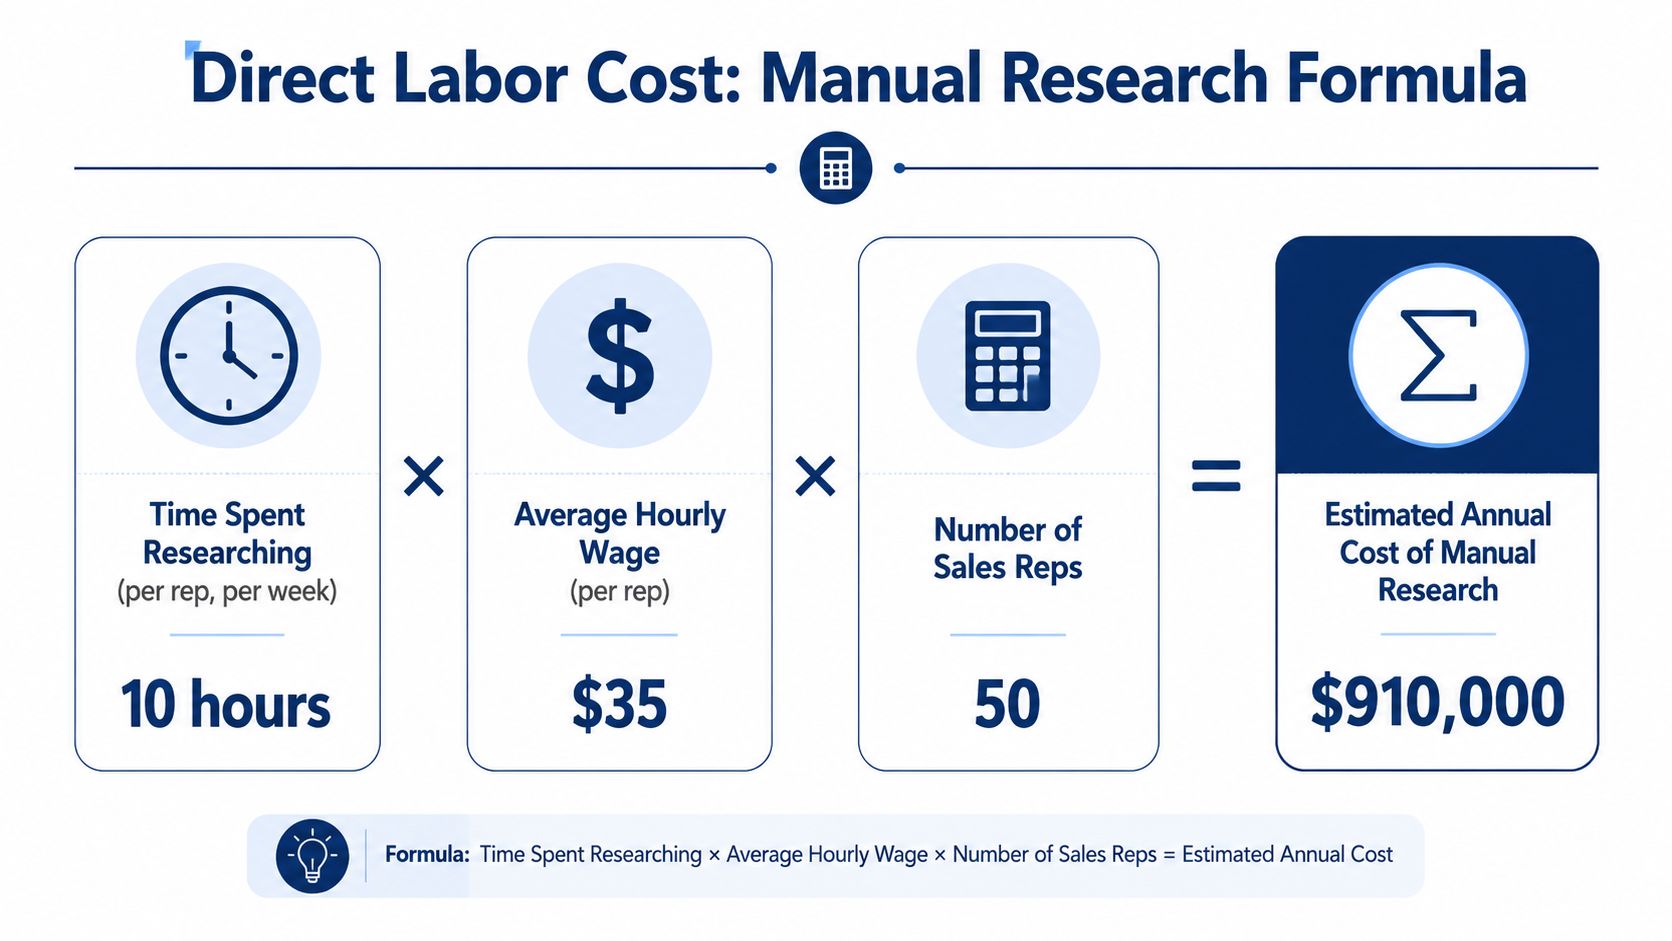
Run an example in Excel
Use a simple sheet with four input cells:
| Input | Example value |
|---|---|
| Number of reps | 50 |
| Research hours per rep per week | 4 |
| Selling weeks per year | 48 |
| Fully loaded hourly rate | $72 |
That gives you:
50 × 4 × 48 × $72 = $691,200 per year
That's the direct annual labor cost of manual account research for the team.
No pipeline assumptions. No win-rate debate. No “soft benefits.” Just labor consumed by manual work.
Practical rule: If your first number already makes people uncomfortable, you've probably found a real structural cost.
Make the number harder to dismiss
Leaders often push back on averages. Fair enough. Use a short time study.
- Track rep research time for two weeks
- Separate manual collection from strategic thinking
- Average the weekly hours
- Multiply by 52 or by your active selling weeks
- Apply your fully loaded hourly cost
If you need help diagnosing where the time goes, this breakdown of how sales reps waste time on research is useful because it mirrors what is commonly observed in practice: source switching, validation, note stitching, and repetition.
There's also a broader operations benchmark worth keeping in mind. Manual knowledge-work tasks have persistent per-task cost. EY research cited by Paycom found that a single manual data entry task without self-service technology costs an average of $4.86, and some manual HR tasks exceed $20 each, including $20.32 to obtain or provide information about benefit plan changes, according to Paycom's review of manual HR process costs. The domain is different, but the cost logic is familiar. Repetitive human lookup and handling work adds up fast.

“The account and contact signals are key for reaching out at important times, and the value-add messaging it creates unique to every contact helps save time and efficiency.”
Daniel Pitman
Mid-Market Account Executive, Black Swan Data
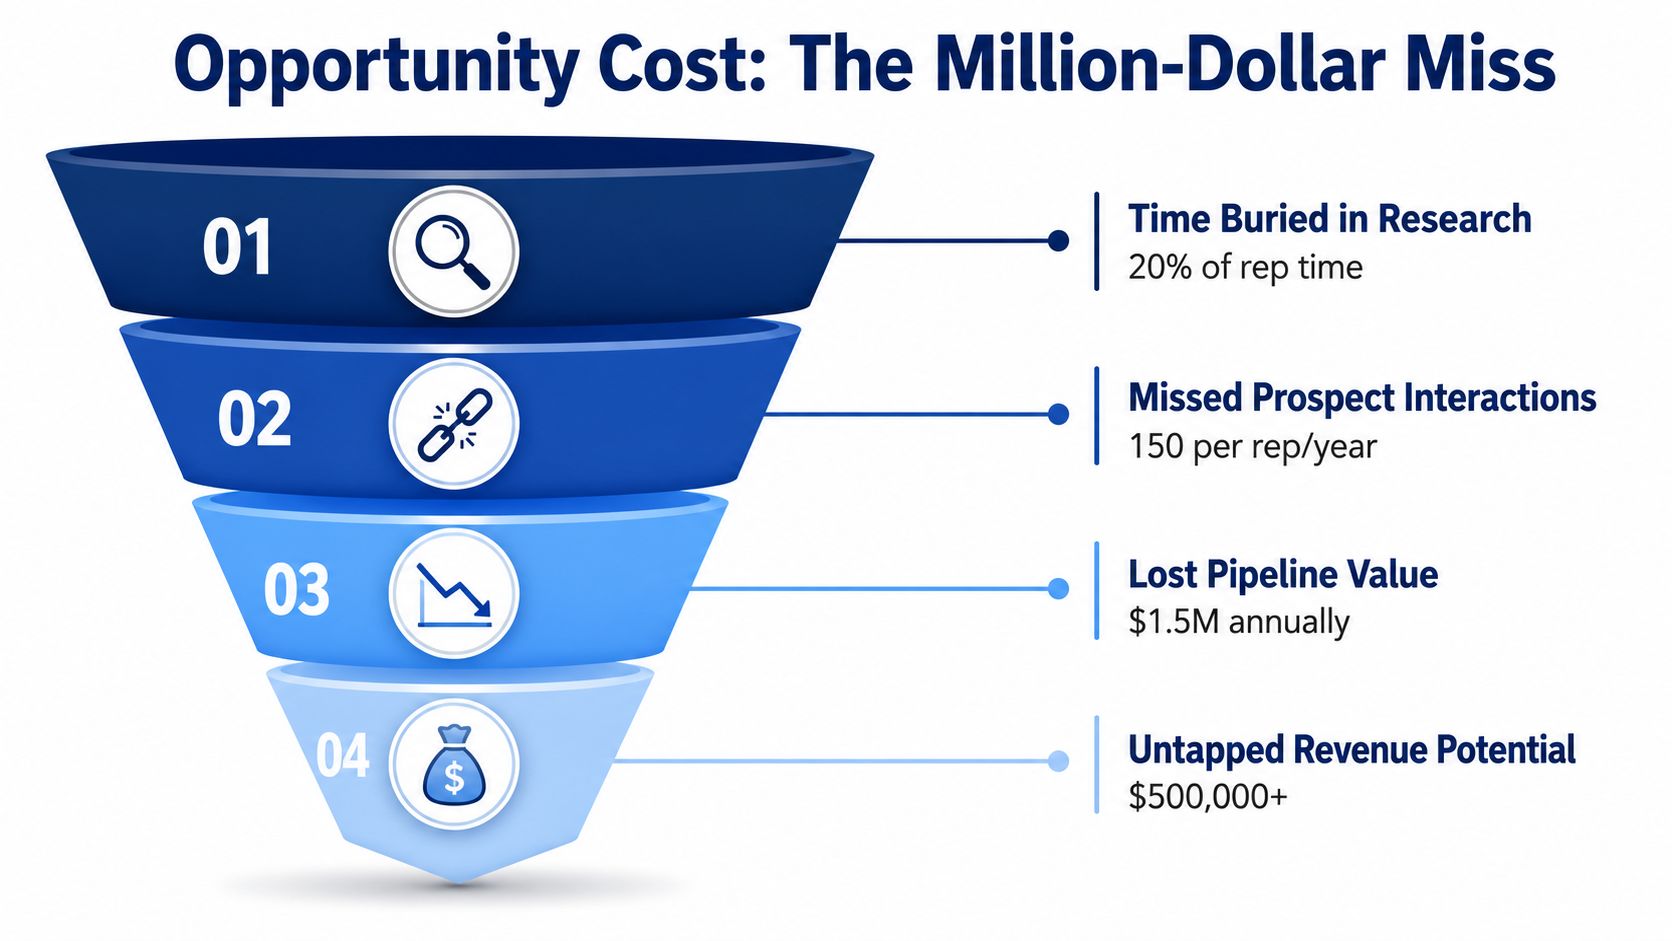
Quantify the Million-Dollar Opportunity Cost
Direct labor cost gets attention. Opportunity cost gets budget.
The cost of manual account research then becomes a revenue conversation instead of a productivity conversation. If reps recover time and redirect it into real selling activity, the upside is materially larger than the wage cost alone.
Use the right formula
The most useful formula is:
Opportunity cost = (Hours saved per week) × (Average meetings booked per hour) × (Average deal value) × (Win rate)
That formula matters because it ties recovered time to the economics your CRO already manages. It doesn't guess. It converts time into expected commercial output.
Build a model with your own numbers
The best way to use the formula is to treat it as a planning model, not a promise. Pull inputs from your own dashboards:
- Hours saved per week from reducing manual research work
- Meetings booked per hour from rep productivity data
- Average deal value from closed-won reporting
- Win rate from your normal conversion reports
Then run a base case, a conservative case, and a stretch case.
Here's what matters operationally. You do not need reps to convert every recovered hour into perfect selling time. Even if only part of that time goes back into prospecting, follow-up, and account progression, the revenue value can dwarf the direct labor cost.
A conservative way to present it
If leadership is skeptical, don't claim all saved time returns to selling. Use a partial capture assumption.
For example, if reps only redirect half of the recovered research time into selling activity, the output still matters. You can then apply your own meeting productivity, average deal size, and win rate to estimate expected revenue impact.
That approach keeps the model credible because it reflects how teams really operate. Some saved time goes to customer work, internal coordination, and deal support. That's normal.
Reclaimed time is only valuable if the team converts it into action. Tie the model to meetings, pipeline creation, and win rate so the argument stays grounded.
Why finance tends to buy this argument
Finance leaders usually accept direct labor models quickly. They become more interested when you show that manual research reduces selling capacity in the same way an unfilled headcount would.
A practical comparison helps:
| View | What it tells you |
|---|---|
| Direct labor cost | What you already spend on manual work |
| Opportunity cost | What your team could produce if that time moved back to selling |
| Combined view | The real economic drag of the current process |
For a CRO, this reframes the issue. You're not choosing between “research” and “no research.” You're choosing between manual research handled by quota-carrying reps and a more scalable way to generate account context without burning selling time.
If you want to pressure-test your assumptions against core funnel math, a pipeline velocity calculator is useful because it forces the discussion back to throughput and revenue mechanics instead of generic efficiency claims.
Uncover the Hidden Costs of Quality and Scale
The spreadsheet view still misses two costly realities. Manual research is inconsistent, and it doesn't scale cleanly.
Both problems show up in live pipeline reviews long before they show up in a budget model.

Quality breaks first
Ask five reps to prepare for the same account and you'll get five different outputs. One rep checks investor commentary, hiring patterns, product launches, and executive changes. Another reads a company page and skims LinkedIn.
That inconsistency creates real commercial risk:
- Weak first outreach because the message isn't anchored to something timely
- Poor discovery quality because the rep misses strategic context
- Bad prioritization because account signals aren't assessed the same way across the team
- More rework because managers and reps revisit accounts to correct gaps
Manual workflows also introduce error and rework. In manual data-entry environments, the average error rate is about 1%, with some contexts reaching 4.0%, according to Invensis on manual data entry challenges. In account research, that means stale titles, conflicting company details, duplicate findings, and time lost verifying what should have been right the first time.
A bad brief doesn't just waste prep time. It can lower outreach relevance, hurt call quality, and force sequence changes later.
Scale breaks next
Manual research scales linearly. If you add more accounts, territories, trigger events, or stakeholders, you add more human hours. The work doesn't compound in your favor.
That's a structural issue for growing teams because it creates a hard choice:
- Cover more accounts with shallow research
- Keep quality high by reducing account coverage
- Add headcount to keep up
None of those options is attractive. The first hurts conversion quality. The second limits coverage. The third raises cost without changing the operating model.
The hidden ceiling on growth isn't always pipeline generation. Sometimes it's the amount of account context your team can gather by hand.
This is why manual account research often feels manageable at small scale and painful at larger scale. The process doesn't improve as volume grows. It just asks for more labor.

“All of the vendors that I've worked with, all of the onboarding that I have had to deal with, I will say, hands down, Salesmotion was the easiest that I have had.”
Lyndsay Thomson
Head of Sales Operations, Cytel
Build Your Business Case for Automation
Once the labor cost, opportunity cost, quality drag, and scale ceiling are visible, the business case becomes straightforward. You're comparing a recurring structural cost to a technology investment that removes repetitive manual work.
A useful analogy comes from operations. A single manual worker handling repetitive account retrieval work can cost $40,000 to $60,000 annually in fully loaded salary and benefits, based on Resolve's labor-cost analysis of manual collections work. Sales isn't collections, but the labor mechanism is the same. Repeated lookup, verification, note preparation, and follow-up turns expensive staff into part-time administrative workers.
What a serious automation case looks like
A strong internal proposal usually has five parts:
- Current-state cost using your direct labor model
- Capacity upside using your opportunity-cost model
- Quality improvement story focused on consistency and freshness
- Scale benefit showing that account coverage no longer rises one-for-one with labor
- Implementation realism with workflow, owners, and measurement
The easiest mistake is overselling AI as a replacement for judgment. That's not the useful comparison. Good systems don't replace rep thinking. They replace manual collection, monitoring, and first-pass synthesis so reps can spend time on interpretation and action.
What to compare vendors on
Not every platform solves the same problem. In this category, I'd compare options using criteria like:
| Decision factor | What to ask |
|---|---|
| Data coverage | Does it pull from the public sources your team actually uses? |
| Signal quality | Does it explain why an event matters, or just dump alerts? |
| Workflow fit | Does it push into Slack, CRM, and email where reps already work? |
| Output quality | Are briefs usable, or are they just scraped summaries? |
| Refresh model | Is the account context static, or does it update continuously? |
One option in this market is Salesmotion, which uses AI agents to monitor target accounts, generate structured briefs, and surface signals from sources such as earnings materials, hiring activity, press releases, executive moves, and other public updates. That's the core use case to evaluate: reducing manual research work while improving timing and context quality.
If you're building the financial narrative for leadership, this perspective on the ROI of sales intelligence tools is a helpful companion because it frames the return in operating terms, not just software terms.
How to present it to a CRO
Keep the deck simple.
Lead with the annual direct labor cost. Then show the selling capacity tied up in manual work. Then explain how inconsistency and linear scaling make the problem worse as the team grows.
Don't pitch “AI” in the abstract. Pitch a better allocation of expensive revenue talent.
Frequently Asked Questions About Research Costs
Leaders usually agree that manual research is inefficient. The debate starts when they try to measure it inside their own team.
How do I know how much time reps really spend researching
Run a short tracking exercise. Two weeks is usually enough to see the pattern.
Have reps log only three categories:
- Manual collection work such as searching sources and gathering updates
- Verification and note prep such as checking titles, confirming events, and writing summaries
- Strategic account thinking such as choosing messaging, priorities, and next steps
Keep those categories separate. If you combine them, people will defend all research time as equally valuable when it isn't.
What should be included in fully loaded cost
Use the cost the business carries, not just salary. That typically includes compensation, benefits, payroll burden, and the support costs required to keep a rep productive.
If finance already has a standard loaded hourly model for workforce planning, use that. It removes a lot of avoidable argument.
My reps are good at research. Why automate any of it
Strong reps should still do judgment-heavy work. They should decide how to approach the account, what message to use, and where risk sits in the deal.
What they shouldn't spend large amounts of time doing is repetitive monitoring, manual source switching, and summary assembly. Human insight is expensive. Save it for interpretation and action.
The right operating model is not “humans or automation.” It's automation for collection and monitoring, humans for judgment and selling.
Is there a good industry benchmark for research time
Not really. Sales leaders often ask whether their team's research load is normal for software, healthcare, finance, or another sector. Cross-industry specificity is still thin.
Some sources note that inefficient operations can cost 2% of total revenue, but there's little detail on how manual research time varies by sector. That makes internal tracking critical. The best benchmark is your own team by segment, territory type, and motion.
What usually goes wrong in these business cases
Three things:
- Teams only count labor cost and ignore lost selling capacity.
- They treat all research time as high value instead of separating collection from judgment.
- They ignore rework and inconsistency, even though those problems affect outreach quality and conversion.
A good model doesn't need perfect precision. It needs enough credibility that the organization can stop pretending this work is free.
If you want to turn this into a real budget case, use Salesmotion to evaluate how much manual account research your team can remove, what signals matter across target accounts, and how much selling time you can realistically give back to reps. The fastest way to get alignment is simple: calculate your current labor cost, model the opportunity cost, and compare that against a tool that automates the repetitive research layer.