Running an Account Based Marketing (ABM) program without the right metrics is like flying blind. You might be moving, but you’re probably not heading toward your target. Generic metrics like total leads or page views don’t tell you the whole story. You need account based marketing metrics that directly connect your team’s effort to revenue.
TL;DR — The 7 ABM metrics that prove ROI: (1) Account Penetration Rate, (2) Account Engagement Score, (3) Pipeline Velocity, (4) Target Account Pipeline, (5) Marketing-Influenced Revenue, (6) Customer Lifetime Value (CLV), and (7) Account Win Rate. For each metric below you get the formula, an industry benchmark, and one actionable tip to improve it.
This article breaks down seven essential ABM metrics, from Account Penetration Rate to Account Win Rate. For each one, you’ll get a clear definition, a simple formula to calculate it, an industry benchmark, and a practical tip you can use today. These insights help everyone—from AEs and SDRs to sales ops and revenue leaders—get on the same page about what success looks like.
Tracking the right KPIs lets your team optimize outreach, put resources where they matter most, and prove ABM’s ROI. Let's get into the metrics that will help you track account health with clear, actionable data.
Before you can master these metrics, it's essential to grasp the importance of data-driven decision-making. Ready to upgrade your ABM playbook and drive measurable growth? Let’s start with the first metric.
1. Account Penetration Rate
Account Penetration Rate tells you how effectively your sales and marketing teams are breaking into your target account list (TAL). It measures the percentage of your ideal customers that you've engaged, have active opportunities with, or have already converted into customers. This metric cuts through vanity metrics like clicks and impressions to show your real progress in capturing market share.

Unlike traditional lead-based funnels, ABM focuses on a finite list of high-value accounts. Your penetration rate directly reflects how well your strategy is working against that list. A low rate might point to issues with your messaging, channels, or the quality of your TAL itself. A high rate proves your efforts are landing with the right audience.
How to Calculate Account Penetration Rate
Calculating this metric is straightforward. Just divide the number of engaged or won accounts by the total number of accounts on your target list, then multiply by 100 to get a percentage.
Formula:
(Number of Engaged/Won Target Accounts / Total Number of Target Accounts) x 100 = Account Penetration Rate (%)
For example, if your TAL has 150 companies and you have active opportunities with 45 of them, your penetration rate is 30%.
Actionable Tips for Improvement
Monitoring this metric is the first step; improving it is the goal. Here are a few ways to increase your account penetration:
- Refine Your TAL: Start with a focused, well-researched target account list, usually between 50-200 accounts. Overly broad lists dilute your efforts and make it hard to gain real traction.
- Set Realistic Benchmarks: For enterprise ABM, a penetration rate of 20-30% is a strong performance. Set goals based on your program's maturity.
- Prioritize with Data: Use intent data to see which accounts are actively researching solutions like yours. Focusing on these high-intent accounts first can speed up penetration. To learn more, explore this guide on buying signals.
- Track by Tier: Segment your TAL into tiers (e.g., Tier 1, Tier 2, Tier 3) and track penetration for each. This helps you ensure your resources are aligned with each account's potential value.
2. Account Engagement Score
An Account Engagement Score is a single number that measures the depth and breadth of interactions from multiple contacts within a target account. It goes beyond individual lead scoring by adding up activities like website visits, content downloads, and event attendance across the entire account. This gives you a holistic view of an account's interest and buying readiness, making it a key part of your account based marketing metrics.

Instead of just tracking activity, an engagement score helps you prioritize which accounts need your sales team's attention now. A high score means multiple stakeholders are actively checking out your solution, signaling a great time for outreach. For example, HubSpot cut its sales cycle by 18% by focusing on accounts with the highest engagement scores, ensuring reps connected at the peak of interest.
How to Calculate Account Engagement Score
To create an Account Engagement Score, you assign points to different marketing and sales interactions and then add them up at the account level.
Formula:
Σ (Activity A * Weight A) + (Activity B * Weight B) + ... for all contacts in an account = Account Engagement Score
For example, a demo request might be worth 50 points, while a whitepaper download is 10. If three people from one account download the whitepaper (30 points) and one requests a demo (50 points), that account's engagement score is 80.
Actionable Tips for Improvement
A well-tuned engagement score can transform your ABM strategy. Here’s how to build and refine your model for maximum impact:
- Start Simple, Then Iterate: Begin with a basic scoring model focused on high-value actions (e.g., demo requests, pricing page visits). As you collect data, you can add more nuance. Advanced methods like AI Lead Scoring playbooks can also refine how you calculate engagement.
- Weight Recent Activities Higher: An action from yesterday is a stronger signal than one from six months ago. Use a "score decay" model where points decrease over time to keep your data fresh.
- Establish Clear Thresholds: Define what a "hot" account looks like. For example, a score over 100 might trigger an immediate alert for an Account Executive to follow up.
- Include Multiple Contacts: The power of account-level scoring is in aggregation. Make sure your model captures engagement from everyone in the buying committee, not just one person. A solid account research checklist can guide this process.
See Salesmotion in action
Take a self-guided interactive tour — no signup required.
3. Pipeline Velocity by Account
Pipeline Velocity by Account measures how quickly your target accounts move through the sales cycle, from first touch to closed-won. This is one of the most important account based marketing metrics because it directly shows the efficiency of your ABM strategy. Faster velocity means your coordinated plays are shortening sales cycles and bringing in revenue sooner.

Unlike traditional sales velocity, which lumps all leads together, this metric gives you an account-centric view. It helps you identify which ABM tactics are smoothing out the buying journey and which accounts are responding best. A high pipeline velocity for ABM accounts compared to non-ABM accounts is clear proof that your strategy is paying off.
How to Calculate Pipeline Velocity by Account
Calculating pipeline velocity involves four key parts: the number of qualified opportunities, the average deal size, the win rate, and the sales cycle length.
Formula:
(Number of Opportunities x Average Deal Size x Win Rate) / Sales Cycle Length in Days = Pipeline Velocity ($ per day)
For example, if you have 20 ABM opportunities with an average deal size of $50,000, a 25% win rate, and a 90-day sales cycle, your pipeline velocity is about $2,778 per day.
Actionable Tips for Improvement
Improving pipeline velocity is all about removing bottlenecks. Here are a few ways to speed up your ABM deals:
- Track Stage-by-Stage Velocity: Don't just measure the overall cycle. Analyze how long accounts spend in each stage (e.g., MQL to SQL, Discovery to Proposal). This pinpoints exactly where deals are getting stuck.
- Compare ABM vs. Non-ABM Performance: Segment your velocity reporting to directly compare target accounts against the rest of your pipeline. This provides clear, quantitative proof of your ABM program's ROI.
- Identify and Nurture Champions: Deals move faster with a strong internal advocate. Focus on identifying these champions within target accounts and giving them the resources they need to build support. To learn more, explore how to generate pipeline by tracking your champions.
- Correlate Velocity with Campaigns: Tie changes in pipeline velocity to specific ABM campaigns. Did velocity increase after you launched a C-level direct mailer? This data helps you double down on what works.
4. Account Coverage Ratio
Account Coverage Ratio measures how deeply you've mapped and engaged with key stakeholders inside your target accounts. It tracks the percentage of relevant decision-makers and influencers your teams have identified and contacted. This metric is vital because modern B2B buying decisions involve a committee of 6-10 people, according to Gartner. Engaging multiple contacts dramatically improves your odds of closing a deal.
A low coverage ratio is a big risk—your deal could be stopped by a stakeholder you never knew existed. A high ratio, on the other hand, shows you have strong relationships across the account and a deep understanding of its internal politics. It validates that your sales and marketing efforts are reaching the entire buying committee.
How to Calculate Account Coverage Ratio
To calculate this, divide the number of key contacts you've identified and engaged by the total estimated number of key stakeholders in those accounts.
Formula:
(Number of Engaged Key Contacts in Target Accounts / Total Estimated Key Contacts in Target Accounts) x 100 = Account Coverage Ratio (%)
For example, if you're targeting 20 accounts and estimate 5 key stakeholders in each (100 total), and your team has engaged with 65 of them, your Account Coverage Ratio is 65%.
Actionable Tips for Improvement
Improving your coverage is about strategic mapping, not just adding more names to a list. Here are a few ways to boost your Account Coverage Ratio:
- Define Your Personas: Clearly identify the key roles in the buying committee (e.g., Economic Buyer, Champion, Technical Influencer). Map your contacts to these personas to ensure you're covering all critical functions.
- Leverage Intelligence Tools: Use platforms like ZoomInfo or LinkedIn Sales Navigator to build out org charts and identify relevant contacts beyond your first touchpoint.
- Aim for 4+ Contacts: Data shows a significant lift in win rates when you engage four or more stakeholders. Set a minimum target of 3-4 engaged contacts for each high-value account.
- Track Engagement Quality: Don't just count contacts; measure the quality of the interaction. A meaningful conversation is worth more than a simple email open.

“We're no longer fishing. We know who the right customers are, and we can qualify them quickly. Salesmotion has had a direct impact on pipeline quality.”
Andrew Giordano
VP of Global Commercial Operations, Analytic Partners
5. Account-Based ROI (Return on Investment)
Account-Based ROI is the ultimate bottom-line metric. It measures the financial return from your ABM investments by comparing the revenue from your ABM programs to their total cost. This is the most critical metric for justifying budgets and showing value to leadership.
Unlike other metrics that track progress, ROI focuses squarely on financial outcomes. It answers the big question: "For every dollar we spend on ABM, how many are we getting back?" A positive ROI proves your account-based approach is a profitable growth engine and shifts the conversation from marketing costs to revenue generation.
How to Calculate Account-Based ROI
Calculating ABM ROI requires tracking both the revenue gained from target accounts and all associated program costs, including tech stacks, ad spend, content creation, and personnel time.
Formula:
([ABM-Generated Revenue - ABM Program Cost] / ABM Program Cost) x 100 = Account-Based ROI (%)
For example, if your ABM program generated $750,000 in revenue with a total cost of $150,000, your ROI would be 400%, or a 4:1 return.
Actionable Tips for Improvement
Maximizing ROI requires a strategic, patient approach. Here are practical ways to improve the financial return on your ABM efforts:
- Implement Multi-Touch Attribution: Use an attribution model that gives credit to multiple touchpoints across the buyer's journey. This ensures you accurately attribute revenue to your ABM activities, not just the last click.
- Track ROI by Account Tier: Not all accounts are equal. Calculate ROI for each of your tiers (e.g., Tier 1, Tier 2) to see where your investments are most effective and reallocate resources accordingly.
- Include Expansion Revenue: Don't just count new customer acquisition. ABM is highly effective for cross-selling and upselling. Including revenue from customer expansion gives a more complete picture of your program's impact.
- Set Realistic Timeframes: ABM is a long game. Meaningful ROI often takes 12-18 months due to longer sales cycles for high-value accounts. Communicate this timeline to stakeholders to manage expectations.
6. Account Progression Rate
Account Progression Rate measures how efficiently your target accounts move through your defined buying stages. Instead of just tracking initial engagement, this metric gives you visibility into the entire account journey, from awareness to purchase. It helps pinpoint exactly where accounts are stalling so you can remove bottlenecks.
This metric is essential for understanding your ABM program's momentum. A high progression rate means your messaging and sales plays are effectively guiding accounts toward a decision. A low rate in a specific stage—like from "Consideration" to "Evaluation"—signals a clear area for improvement.
The following infographic shows a sample ABM funnel, highlighting conversion rates between key stages.
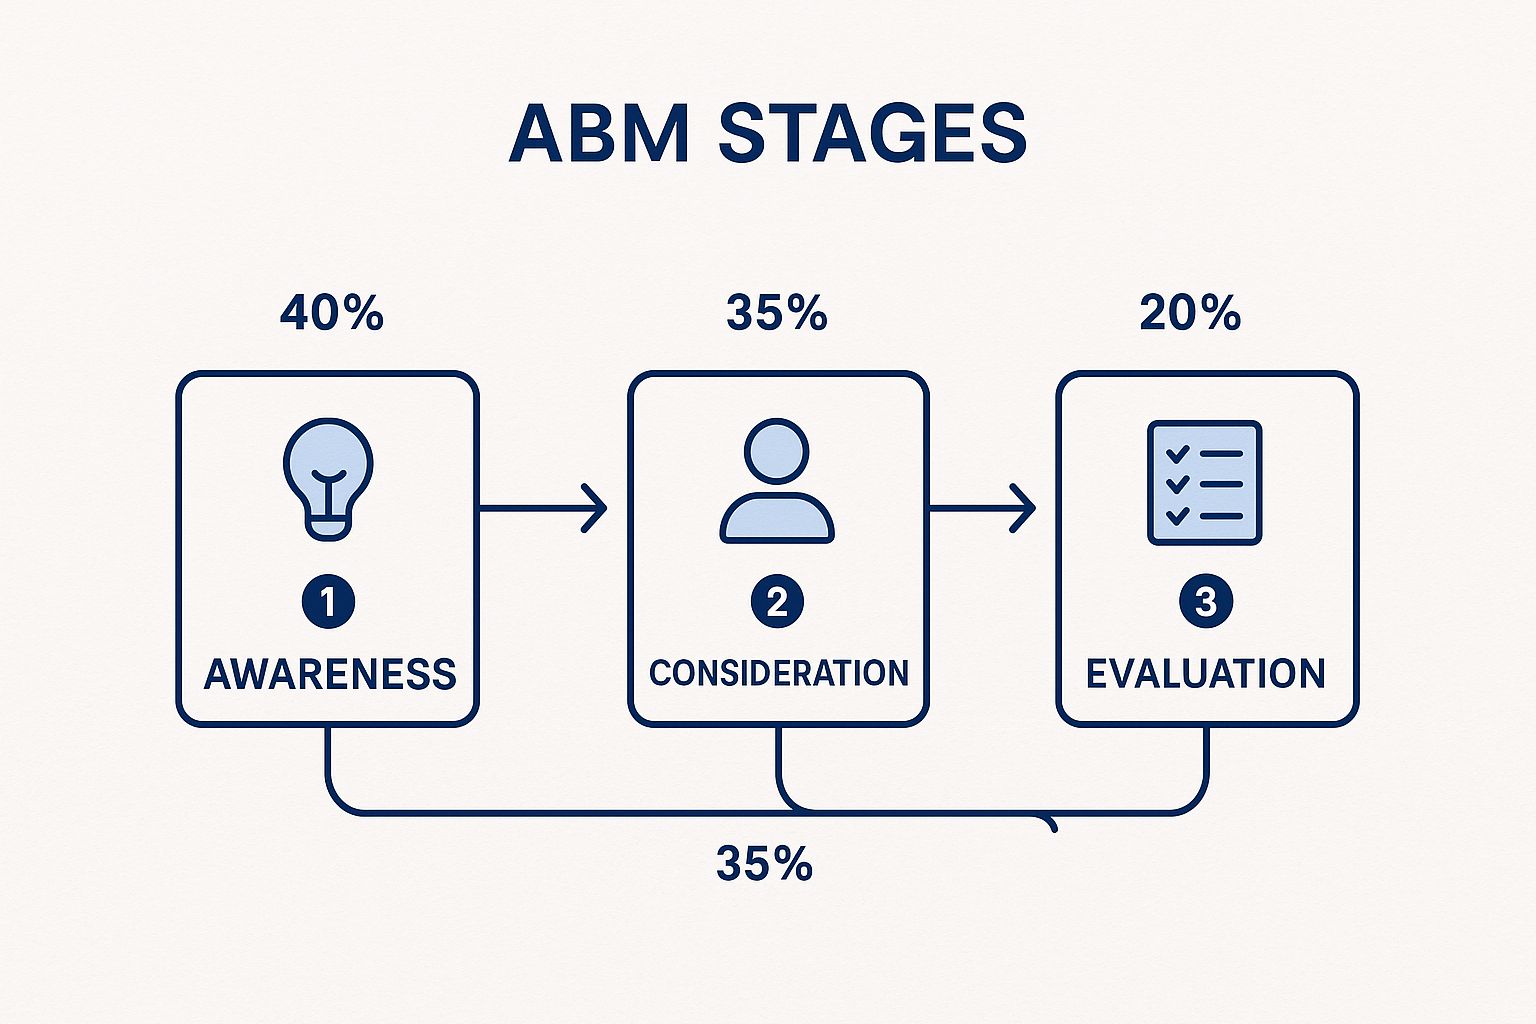
This visual shows the biggest drop-off happens between the Evaluation and Purchase stages, indicating a need to strengthen late-stage efforts.
How to Calculate Account Progression Rate
First, you need clearly defined criteria for each stage of your ABM funnel. The calculation measures the percentage of accounts that move from one stage to the next within a set time frame.
Formula:
(Number of Accounts in Stage B / Number of Accounts in Stage A) x 100 = Progression Rate from A to B (%)
For instance, if 100 target accounts were in the "Awareness" stage last quarter and 40 have since moved to "Consideration," your progression rate for that transition is 40%.
Actionable Tips for Improvement
Improving your progression rate requires a stage-by-stage approach. Here are a few strategies to drive momentum:
- Define Clear Stage Criteria: Establish objective, data-driven triggers for stage advancement. For example, moving from "Awareness" to "Consideration" might require multiple stakeholders to attend a webinar.
- Create Stage-Specific Plays: Develop content and marketing tactics tailored to each stage. An account in "Consideration" might need a case study, while one in "Evaluation" needs a personalized demo.
- Focus on Bottlenecks: Analyze your data to find the stage with the lowest conversion rate. Allocate extra resources, like targeted ads or sales outreach, to fix this specific transition.
- Track Forward and Backward Movement: Accounts don't always move in a straight line. Track backward movement (e.g., from "Evaluation" back to "Consideration") to identify deals that are losing steam and re-engage them.
7. Account Win Rate
Account Win Rate is one of the most powerful account based marketing metrics for proving ROI. It measures the percentage of targeted opportunities that become closed-won deals. It cuts through all the noise to answer the ultimate question: is your ABM strategy helping you win more of the right business?
By isolating the win rate for ABM-targeted accounts, you get a clear view of your program's impact on revenue. For example, Snowflake reported a 45% win rate for its ABM accounts compared to just 18% for non-ABM accounts. DocuSign saw its enterprise win rate jump from 25% to 52% after implementing ABM. These numbers show the direct influence of a well-run ABM strategy.
How to Calculate Account Win Rate
This calculation compares the success of ABM-influenced deals with all other opportunities. It's essential to track both to show the lift from your account-based efforts.
Formula:
(Number of Won Target Accounts / Total Number of Opportunities in Target Accounts) x 100 = Account Win Rate (%)
For a meaningful comparison, you should also calculate the win rate for non-ABM accounts. If you won 25 out of 50 ABM opportunities, your ABM win rate is 50%. If you won 40 out of 200 non-ABM opportunities, your baseline win rate is 20%, showing a significant lift.
Actionable Tips for Improvement
Improving your win rate involves a deep look at your entire sales and marketing process. Here are several strategies to drive this crucial metric higher:
- Analyze Loss Reasons: Track and categorize why you lose deals in your target accounts. Are you losing on price, features, or to a specific competitor? This data gives you a direct roadmap for improvement.
- Compare ABM Tactics: Don't treat all ABM efforts the same. Compare the win rates for accounts that got high-touch tactics (like executive dinners) versus those with lighter-touch digital campaigns. This helps you optimize resource allocation.
- Contextualize with Deal Size: A high win rate on small deals isn't as valuable as a solid win rate on large, strategic ones. Analyze win rate alongside Average Contract Value (ACV) to ensure you are winning the right deals.
- Refine Your Sales Approach: A higher win rate is often the result of a better sales methodology. To find the right fit, you can explore this practical guide to sales methodologies.
7 Key Account-Based Marketing Metrics Comparison
| Metric | Implementation Complexity | Resource Requirements | Expected Outcomes | Ideal Use Cases | Key Advantages |
|---|---|---|---|---|---|
| Account Penetration Rate | Low | Moderate data tracking and segmentation | Measures % of engaged target accounts | Early ABM program reach and footprint expansion | Simple to understand, benchmarks coverage gaps |
| Account Engagement Score | Medium to High | Complex data integration, scoring models | Holistic engagement measurement, priority targeting | Prioritizing sales efforts, identifying intent | Comprehensive view, predictive of buying signals |
| Pipeline Velocity by Account | Medium | Sales and marketing alignment, data tracking | Measures speed of deals through pipeline | Optimizing sales cycle and process bottlenecks | Direct link to revenue acceleration, ROI justification |
| Account Coverage Ratio | Medium | Extensive stakeholder research and maintenance | % of engaged key stakeholders | Deep stakeholder engagement, complex buying groups | Improves win rates, reduces deal risk |
| Account-Based ROI | High | Advanced analytics and multi-touch attribution | Financial return on ABM investments | Justifying ABM budgets, executive reporting | Clear business justification, budget optimization |
| Account Progression Rate | Medium | Consistent data collection and stage definition | Tracks account movement through ABM stages | Identifying bottlenecks in account journey | Detailed journey insights, stage-specific optimization |
| Account Win Rate | Low to Medium | Sales tracking with sufficient sample size | % of target accounts converted to customers | Evaluating program effectiveness and targeting | Direct effectiveness measure, informs targeting |
ABM Metric Benchmarks: What "Good" Looks Like
One of the most common questions about account based marketing metrics is: "What numbers should we be hitting?" Benchmarks vary by industry and deal size, but these ranges give you a realistic baseline for evaluating your program.
| Metric | Below Average | Average | Strong | Elite |
|---|---|---|---|---|
| Account Penetration Rate | <10% | 10–20% | 20–30% | 30%+ |
| Account Engagement Score | Score decline QoQ | Flat QoQ | 10–20% increase QoQ | 20%+ increase QoQ |
| Pipeline Velocity (ABM vs. non-ABM) | Same or slower | 10–25% faster | 25–50% faster | 50%+ faster |
| Account Coverage Ratio | <2 contacts/account | 2–3 contacts/account | 4–5 contacts/account | 6+ contacts/account |
| Account-Based ROI | <100% (negative ROI) | 100–200% | 200–400% | 400%+ |
| Account Progression Rate | <15% stage-to-stage | 15–25% | 25–40% | 40%+ |
| Account Win Rate (ABM) | <20% | 20–30% | 30–45% | 45%+ |
Context matters. Enterprise ABM programs targeting $100K+ ACV deals will naturally have lower win rates and longer cycles than mid-market programs. The key comparison is ABM accounts vs. your non-ABM baseline — the lift between the two is what proves program effectiveness.
According to ITSMA research, mature ABM programs consistently deliver:
- 171% higher ACV than non-ABM deals
- 2–3x higher engagement rates across the buying committee
- 30–50% faster pipeline velocity for Tier 1 accounts
- 137% average ROI within the first 18 months
How Signal Monitoring Improves Every ABM Metric
Each of these metrics improves when your team knows when an account is showing intent, not just that it matches your ICP. Signal monitoring — tracking buying signals like leadership changes, funding rounds, hiring surges, and technology adoption — feeds directly into ABM execution:
- Penetration Rate increases because signal-triggered outreach gets more responses than cold ABM touches.
- Engagement Score rises when campaigns are timed to coincide with real business events that make your message relevant.
- Pipeline Velocity accelerates when reps engage accounts during an active buying window rather than an arbitrary campaign schedule.
- Win Rate improves because signal-informed deals start with context ("Congrats on the Series C — here's how we help teams scaling from 50 to 200 reps") instead of generic positioning.
The most effective ABM programs in 2026 are signal-based: they use real-time intelligence to trigger plays rather than relying on static account lists and quarterly campaign calendars.
Key Takeaways
- Account-based marketing metrics focus on account-level engagement and outcomes rather than vanity metrics like total leads or page views.
- The seven essential ABM metrics -- Account Penetration Rate, Account Engagement Score, Pipeline Velocity, Account Coverage Ratio, Account-Based ROI, Account Progression Rate, and Account Win Rate -- together give a 360-degree view of program health.
- Pipeline Velocity by Account is one of the clearest indicators of ABM effectiveness because it directly measures how quickly your coordinated plays convert target accounts into revenue.
- Tracking Account Coverage Ratio ensures you are engaging enough decision-makers within each buying committee, which data shows significantly improves win rates when you reach four or more stakeholders.
- Meaningful ABM ROI typically takes 12 to 18 months due to longer enterprise sales cycles, so set realistic timeframes with stakeholders early.
- Use these metrics in a dynamic feedback loop: refine your target account list, optimize engagement plays, and strengthen sales-marketing alignment based on what the data reveals.
Turning Metrics Into Momentum
We’ve covered seven critical account based marketing metrics that give you a 360-degree view of your program's health. Moving beyond old-school, lead-centric measurement is the first and most important step in building a successful ABM engine. Metrics like Account Penetration Rate and Account Coverage Ratio assess your reach, while the Account Engagement Score tells you how well you're connecting with your targets.
But tracking is only half the battle. The real power comes from using these metrics to inform your strategy and drive action. For a deeper dive into which ABM metrics predict revenue, see our companion guide. A dip in Pipeline Velocity by Account might mean you need to refine your messaging. A low Account Progression Rate could point to a disconnect between sales and marketing plays. These numbers aren't just for dashboards; they're signposts guiding you to better execution.
From Data Points to Strategic Decisions
The goal is to create a dynamic feedback loop where data constantly refines your strategy. Here’s how to translate these insights into your next steps:
- Refine Your Target Account List: Use Account-Based ROI and Account Win Rate to identify the traits of your most profitable accounts. Double down on acquiring similar accounts and consider deprioritizing those that consistently underperform.
- Optimize Engagement Plays: Look at your Account Engagement Scores. Which channels and content pieces are working? Which ones are falling flat? Reallocate your budget and creative resources to the tactics that move the needle.
- Strengthen Sales and Marketing Alignment: Pipeline Velocity and Account Progression rates are shared metrics. Use this data in joint meetings to diagnose bottlenecks, streamline handoffs, and ensure both teams are working together to accelerate deals.
The Bigger Picture: Building a Revenue Engine
Mastering your account based marketing metrics transforms your ABM program from a set of campaigns into a predictable revenue engine. It shifts the conversation from "How many leads did we get?" to "How effectively are we influencing our most important accounts?" This account-centric view aligns your entire go-to-market team around one goal: generating revenue from the businesses that matter most.
By consistently monitoring and acting on these seven core metrics, you empower your team to make smarter decisions, build stronger relationships, and drive sustainable growth. You move from guesswork to a data-driven strategy, ensuring every dollar is invested for maximum impact.
Frequently Asked Questions
What is the difference between ABM metrics and traditional marketing metrics?
Traditional marketing metrics like total leads and cost-per-click measure broad funnel activity. ABM metrics focus on the quality and depth of engagement within a curated set of high-value target accounts. They track account-level progress such as penetration rate, coverage ratio, and account win rate, directly connecting marketing effort to revenue outcomes.
How many ABM metrics should a team track at once?
Start with three to four metrics that align with your program maturity and goals. For newer programs, Account Penetration Rate and Account Engagement Score are strong starting points. As your ABM motion matures, layer in Pipeline Velocity, Account Win Rate, and Account-Based ROI to get the full picture.
How do I calculate Account-Based ROI if my sales cycles span multiple quarters?
Track cumulative ABM program costs against cumulative revenue from target accounts over the full sales cycle window. Use multi-touch attribution to credit marketing touchpoints across the buyer journey. Set the measurement window to at least 12 to 18 months for enterprise deals to capture the true return.
What is a good benchmark for Account Penetration Rate?
For enterprise ABM programs, a penetration rate of 20 to 30 percent is considered strong. The right benchmark depends on the size of your target account list and your program's maturity level. Start with a focused list of 50 to 200 accounts and set incremental goals based on quarterly improvement.
Ready to stop guessing and start acting on your account based marketing metrics? Salesmotion is an AI-powered platform that automatically monitors engagement signals and generates actionable insights to help your team influence these key metrics. See how you can turn your data into deals by visiting Salesmotion today.