Sales forecasting is the process every revenue leader claims to prioritize and almost no one does well. According to Gartner, fewer than 25% of sales organizations achieve forecast accuracy within 10% of actual results. The consequences are real: overforecasting leads to overhiring and missed expectations with the board. Underforecasting leads to missed opportunities and insufficient pipeline investment. The root cause isn't a lack of effort. It's that most teams rely on a single forecasting method when the most accurate approach combines multiple methods weighted by deal stage and data quality. Strong CRM hygiene is the prerequisite that makes every method more reliable.
TL;DR: There are seven primary sales forecasting methods, each with different accuracy profiles. Gut-feel and rep-submitted forecasts are the least accurate (±30-40% variance). Weighted pipeline and stage-based methods improve to ±15-25%. Multi-variable models combining historical data, pipeline signals, and deal-level analysis achieve ±5-15% accuracy. The best forecasting organizations use different methods at different stages and reconcile them into a single view.
The Seven Sales Forecasting Methods
1. Rep-Submitted (Bottom-Up) Forecasting
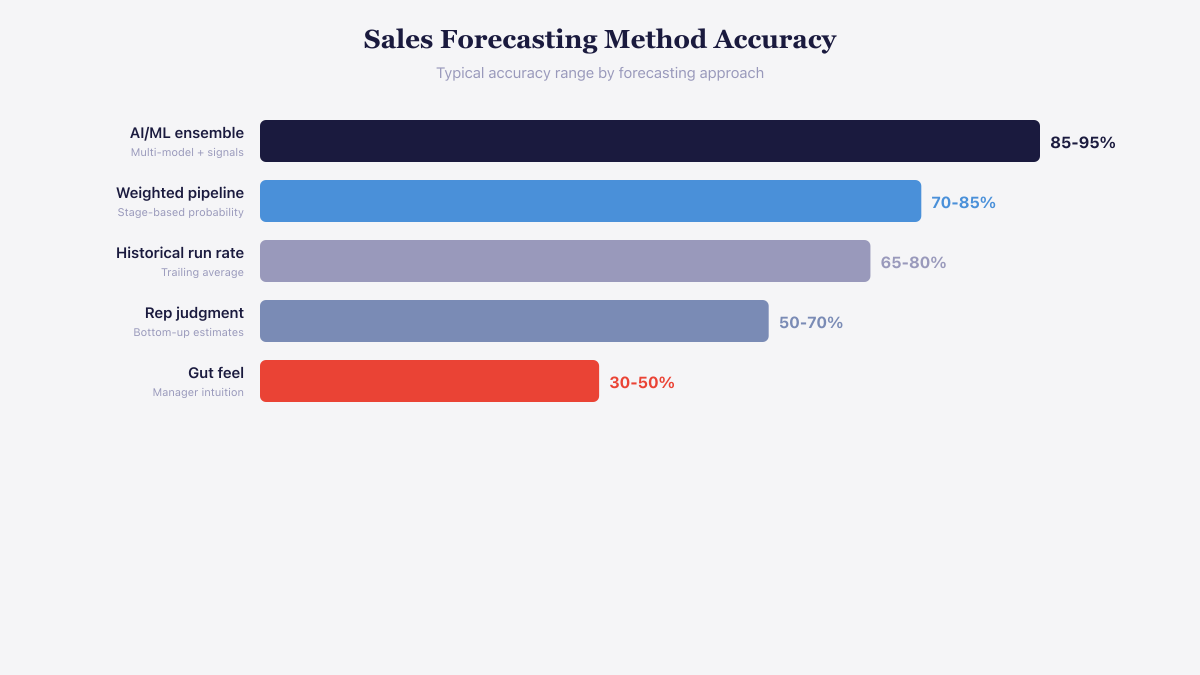 AI/ML ensemble forecasting delivers 85-95% accuracy compared to 30-50% for gut feel.
How it works: Each rep submits their estimate of what they'll close this period based on their pipeline conversations.
Accuracy benchmark: ±30-40% variance from actual results.
Why it's used: It's the simplest method and captures qualitative intelligence that data alone misses. A rep knows that a champion just got promoted, that the CFO is skeptical, or that a competitor is offering a steep discount.
Why it fails: Optimism bias is built into the system. Reps overweight positive signals and underweight risks. Sandbagging creates the opposite problem: experienced reps lowball forecasts to guarantee overperformance. Neither behavior produces reliable numbers.
When to use it: As one input among several. Rep judgment is valuable for deal-level context but unreliable as the sole forecasting method.
2. Historical Run-Rate Forecasting
How it works: Project future revenue based on historical performance trends. If Q1 revenue grew 15% year-over-year for the past three years, forecast Q1 at 15% growth.
Accuracy benchmark: ±20-30% in stable markets. Much worse during market transitions.
Why it's used: Simple to calculate, requires no pipeline data, and provides a baseline for comparison.
Why it fails: Assumes the future will look like the past. Market shifts, competitive changes, pricing adjustments, and team composition changes all break the assumption. A company that grew 15% with 10 reps won't automatically grow 15% with 20 reps if the market is saturated.
When to use it: As a sanity check against other methods. If your pipeline-based forecast shows 50% growth but your historical run rate has never exceeded 20%, the gap demands investigation.
3. Weighted Pipeline Forecasting
How it works: Multiply each deal's value by its probability of closing based on its current pipeline stage. A $100K deal at the proposal stage with a 50% close rate contributes $50K to the forecast.
Accuracy benchmark: ±15-25% variance.
Why it's used: It's data-driven, easy to automate, and leverages the pipeline infrastructure most teams already have.
Why it fails: The probability weights are often wrong. Most teams use generic stage probabilities (20% at discovery, 50% at proposal, 80% at negotiation) that don't reflect their actual conversion rates. Additionally, treating all deals at the same stage as equally likely ignores deal-specific risk factors.
When to use it: As a starting point that's refined with deal-level adjustments. Calculate your actual stage conversion rates from historical data rather than using generic benchmarks.
4. Stage-Duration Forecasting
How it works: Track how long deals spend in each pipeline stage and flag deals that exceed average duration as at-risk. Deals moving faster than average are weighted higher.
Accuracy benchmark: ±15-20% when combined with weighted pipeline.
Why it's used: Deal velocity is one of the strongest predictors of close probability. Deals that stall at a stage longer than average are statistically less likely to close.
Why it fails in isolation: Duration alone doesn't explain why a deal is stalled. A deal might be slow because the buying committee is large (normal for enterprise) or because the champion has gone quiet (red flag). Context matters.
When to use it: As a complement to weighted pipeline. Flag slow-moving deals for rep review rather than automatically downweighting them.
5. Multi-Variable (Regression) Forecasting
How it works: Build a statistical model that considers multiple deal attributes: deal size, number of stakeholders engaged, days since last activity, product fit score, competitive presence, and historical patterns for similar deals.
Accuracy benchmark: ±10-15% for teams with sufficient historical data (500+ closed deals).
Why it's used: It captures interactions between variables that simpler methods miss. A large deal with an active champion moves differently than a large deal with a single contact.
Why it fails: Requires clean data and statistical expertise. Garbage-in-garbage-out applies forcefully: if CRM data is inconsistent or incomplete, the model produces confident but wrong predictions.
When to use it: When you have at least 500 closed deals with consistent data capture across key fields. This typically requires a dedicated RevOps or data analytics function.
6. AI and Machine Learning Forecasting
How it works: ML models analyze deal progression patterns, rep activity data, email sentiment, meeting frequency, and external signals to predict close probability for each deal.
Accuracy benchmark: ±5-15% for mature implementations.
Why it's used: ML models can process signals that humans miss: changes in email response time, shifts in stakeholder engagement patterns, and correlations between activity patterns and outcomes.
Why it fails: Black box problem. When the model says a deal has 30% probability, the sales manager can't easily understand why or how to improve it. Adoption suffers when reps can't see the logic. Models also degrade if the underlying market dynamics change (as happened to many COVID-era models).
When to use it: When you have sufficient data, clean CRM hygiene, and the willingness to validate model predictions against actual outcomes for at least two quarters before relying on them.
7. Top-Down Capacity Forecasting
How it works: Start with the market opportunity and work backward through realistic constraints: total addressable accounts × expected penetration rate × average deal size × expected close rate.
Accuracy benchmark: ±20-30% at the annual level.
Why it's used: It reality-checks bottom-up forecasts by asking whether the team has sufficient capacity and market access to hit the number.
Why it fails: Assumes uniform performance across reps and territories, which never holds. Top performers deliver 3-5x the pipeline of bottom performers.
When to use it: For annual planning and new territory evaluation. Compare top-down capacity against bottom-up pipeline to identify whether shortfalls are pipeline problems or conversion problems.
Building a Blended Forecasting Model
The most accurate organizations don't use one method. They blend multiple approaches and reconcile the outputs.
Recommended blend by forecast horizon:
| Horizon | Primary Method | Secondary Check | Accuracy Target |
|---|---|---|---|
| This month | Weighted pipeline + rep adjustments | Deal-level review with stage duration flags | ±5-10% |
| This quarter | Multi-variable model or ML | Historical run rate comparison + capacity check | ±10-15% |
| Next quarter | Weighted pipeline + signal adjustments | Top-down capacity model | ±15-20% |
| Annual | Top-down capacity × historical conversion | Bottom-up pipeline build plan | ±20-25% |
The reconciliation process:
- Run each applicable method independently.
- Compare outputs. Where do they agree? Where do they diverge?
- Investigate divergences. If weighted pipeline shows $2M but historical run rate shows $1.5M, the $500K gap is either unrealistic pipeline or a genuine growth trend. Determine which.
- Use deal-level signals to adjust. Buying signals like leadership changes, funding events, and competitive moves provide real-time context that improves weighted pipeline accuracy. Deals at accounts showing active signals should be weighted higher than deals at dormant accounts.
- Document assumptions. Every forecast should state what must be true for the number to hold. "This forecast assumes 3 deals at the negotiation stage close by month-end" is testable and revisable.
See the product in action
Take a self-guided tour of the Salesmotion platform — no signup required.
Improving Forecast Accuracy: What Actually Works
Fix your stage definitions first
Most forecast inaccuracy stems from inconsistent pipeline stages. If one rep marks a deal as "proposal sent" when they've emailed a pricing PDF and another marks it when they've presented a formal SOW to the economic buyer, the same stage label represents entirely different deal maturity. Define clear, verifiable exit criteria for each stage.
Separate commit from best-case
Force reps and managers to provide two numbers: commit (deals they would bet their job on closing this period) and best-case (deals that could close if everything goes right). The commit forecast should have ±5% accuracy. The best-case provides upside visibility without inflating the primary number.
Use signals to validate pipeline
Deals sitting at the same stage for weeks without account-level activity signals (no leadership changes, no competitive evaluations, no hiring that suggests investment) are likely stalled. Salesmotion's account intelligence provides the external validation that pipeline stage data alone can't: it monitors 1,000+ sources per account and surfaces whether the deal's account shows active buying signals or has gone dormant. When signals are active, the deal is more likely real. When the account is dormant, the deal deserves scrutiny regardless of what the rep reports.
Review forecast accuracy retroactively
After each period closes, compare the forecast to actual results for each method, each rep, and each segment. Track accuracy trends over time. If a specific method is consistently 15% optimistic, apply a systematic adjustment. If a specific rep is consistently 25% pessimistic, their commit number actually represents more pipeline than they're reporting.
Key Takeaways
- Seven primary forecasting methods range from ±5% accuracy (ML models with clean data) to ±40% (rep-submitted gut feel). No single method is sufficient alone.
- Blend methods by time horizon: deal-level analysis for this month, multi-variable models for this quarter, capacity models for annual planning.
- Fix pipeline stage definitions before improving forecasting methods. Inconsistent stages guarantee inaccurate forecasts regardless of methodology.
- Separate commit and best-case forecasts. The commit number should be within 5% of actual. Best-case provides upside visibility.
- Validate pipeline with external signals. Deals at accounts showing buying activity are more credible than deals at dormant accounts, regardless of reported stage.
- Retroactively measure forecast accuracy by method, rep, and segment. Systematic biases can be adjusted once identified.

“We're no longer fishing. We know who the right customers are, and we can qualify them quickly. Salesmotion has had a direct impact on pipeline quality.”
Andrew Giordano
VP of Global Commercial Operations, Analytic Partners
Frequently Asked Questions
What is the most accurate sales forecasting method?
Multi-variable regression models and machine learning approaches achieve the highest accuracy (±5-15%) for organizations with sufficient historical data and clean CRM hygiene. However, accuracy depends more on data quality and consistent process than on the specific method. A well-executed weighted pipeline forecast with real stage conversion rates and signal-based adjustments can match ML accuracy for near-term forecasts.
How do you calculate a weighted pipeline forecast?
Multiply each deal's value by the historical close rate for its current pipeline stage. For example, if deals at the negotiation stage close 65% of the time, a $100K deal at negotiation contributes $65K to the forecast. Sum all weighted values for the total forecast. Critical: use your own historical conversion rates, not generic benchmarks. A 50% close rate at proposal stage is meaningless if your actual rate is 30%.
How often should sales forecasts be updated?
Weekly for current-quarter forecasts, with daily monitoring of commit deals in the final month of the quarter. Monthly for next-quarter forecasts. Quarterly for annual forecasts. The cadence should match the rate of change: enterprise deals with long cycles need less frequent updates than high-velocity inside sales motions where pipeline can shift dramatically week to week.
What causes sales forecast inaccuracy?
The top causes are: inconsistent pipeline stage definitions (reps interpreting stages differently), optimism bias in rep-submitted forecasts, stale deals inflating pipeline. Account intelligence can flag dormant deals that inflate forecasts (deals sitting at stages longer than average without being cleaned), insufficient data for statistical models, and external factors (market shifts, competitive moves) not being captured in the forecasting model. Addressing stage definitions and pipeline hygiene typically produces the largest accuracy improvement with the least effort.