Account-based marketing (ABM) generates more data than any other B2B marketing strategy. The typical ABM program tracks impressions, clicks, engagement scores, MQLs, website visits, content downloads, ad interactions, and dozens of other metrics across hundreds of target accounts. The paradox: more data hasn't produced better measurement. Most ABM teams can't answer the question that matters: "Is our ABM program generating revenue that wouldn't have happened otherwise?" The metrics that fill dashboards (account engagement scores, impressions served, contacts reached) measure activity, not business impact. This guide focuses on the ABM metrics that actually predict and measure revenue contribution.
TL;DR: The ABM metrics that predict revenue are: pipeline velocity by account tier, account engagement-to-pipeline conversion, influenced revenue (properly attributed), and cost per opportunity by program. Vanity metrics like "accounts reached" and "engagement scores" don't correlate with revenue outcomes. The most important metric for any ABM program is incremental pipeline: pipeline created from ABM-targeted accounts that exceeds what those accounts would have generated without ABM intervention.
Why Most ABM Metrics Don't Predict Revenue
The Engagement Score Problem
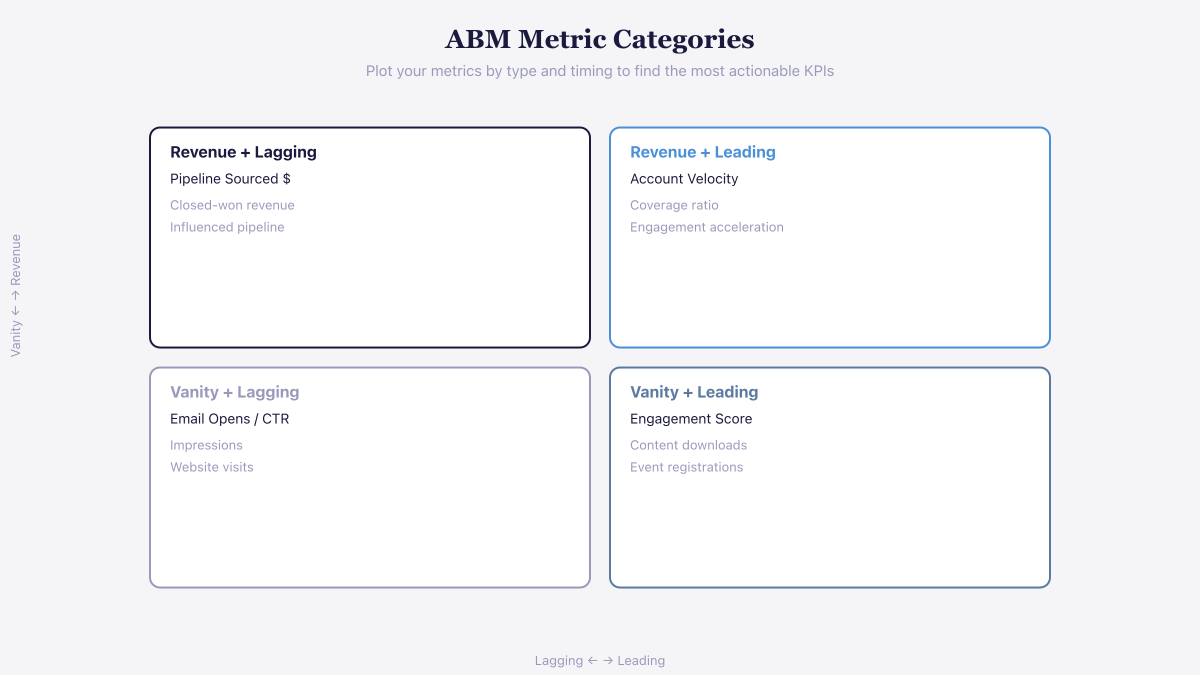 Plot your ABM metrics by type and timing to identify which ones actually drive revenue.
ABM platforms generate composite "engagement scores" for each target account: a weighted sum of ad impressions, website visits, content downloads, email opens, and other interactions. A high engagement score is supposed to indicate buying readiness.
The problem: engagement doesn't equal intent to purchase. An account that downloads 5 white papers and attends 3 webinars might be building internal knowledge with no budget or timeline. An account with low engagement but a new CRO who previously bought your product at their last company might be a better opportunity.
Engagement scores measure the volume of marketing touches received, not the quality of buying signals. They create false confidence in accounts that are marketing-responsive but not sales-ready, and miss accounts that are actively buying through channels your engagement scoring doesn't capture.
The Attribution Problem
ABM campaigns touch accounts through multiple channels over months. When a deal closes, determining how much ABM contributed versus sales effort, product reputation, or organic demand is genuinely difficult. Most ABM teams default to one of two extremes:
Full attribution (overcounting): "Our ABM campaign touched this account, so all pipeline from this account is ABM-influenced." This credits ABM for pipeline that would have happened regardless.
No attribution (undercounting): "We can't prove ABM caused this deal, so we don't attribute it." This undervalues ABM's contribution and leads to budget cuts.
The honest approach is incremental measurement: comparing outcomes from ABM-targeted accounts against a control group of similar accounts that didn't receive ABM treatment.
See Salesmotion on a real account
Book a 15-minute demo and see how your team saves hours on account research.
The ABM Metrics That Actually Predict Revenue
1. Pipeline Velocity by Account Tier
What it measures: How fast deals move through the pipeline for ABM-targeted accounts compared to non-ABM accounts.
Why it predicts revenue: If ABM is working, targeted accounts should progress faster through the pipeline because marketing has warmed the buying committee, built brand awareness, and educated stakeholders before sales engages. If ABM-targeted accounts move at the same speed as non-targeted accounts, the marketing spend isn't accelerating the buying process.
How to calculate:
Pipeline Velocity = (Opportunities × Average Deal Size × Win Rate) ÷ Average Sales Cycle Length
Compare velocity for:
- Tier 1 ABM accounts (highest-touch programs)
- Tier 2 ABM accounts (moderate-touch programs)
- Non-ABM accounts (organic pipeline)
Target: ABM Tier 1 accounts should show 20-40% faster velocity than non-ABM accounts. If they don't, the ABM program is adding cost without accelerating revenue.
2. Account Engagement-to-Pipeline Conversion
What it measures: The percentage of engaged ABM accounts that generate qualified pipeline.
Why it predicts revenue: This metric connects marketing activity to sales outcomes. If 200 accounts show "high engagement" but only 10 generate qualified pipeline, the engagement isn't translating to buyer readiness. The conversion rate tells you whether your ABM targeting, messaging, and channel mix are reaching the right people with the right message.
How to calculate: Accounts with qualified pipeline ÷ Accounts with above-threshold engagement × 100
Benchmarks:
- Tier 1 (1:1 programs): 30-50% engagement-to-pipeline conversion
- Tier 2 (1:few programs): 15-25% engagement-to-pipeline conversion
- Tier 3 (1:many programs): 5-10% engagement-to-pipeline conversion
If conversion is below benchmark: The issue is either targeting (wrong accounts), messaging (not resonating with the buying committee), or channel mix (reaching the wrong people within the account).
3. Influenced Revenue (Properly Measured)
What it measures: Revenue from deals where ABM activities reached the buying committee during the sales cycle.
Why it predicts revenue: When properly measured (against a control group), influenced revenue quantifies the financial contribution of ABM beyond what organic pipeline would have generated.
How to measure properly:
- Create a control group: Identify accounts that match your ABM target criteria but are not receiving ABM treatment. (This requires discipline — holding back eligible accounts from ABM programs.)
- Compare outcomes: Pipeline created, win rate, deal size, and sales cycle length for ABM accounts vs. control accounts.
- Calculate the increment: The difference in revenue between ABM-treated and control accounts is the incremental contribution of ABM.
Example: If ABM-treated accounts generate $5M in pipeline with a 25% win rate ($1.25M revenue) and comparable control accounts generate $3.5M in pipeline with a 20% win rate ($700K revenue), the ABM increment is $550K. That $550K, minus ABM program costs, is the true ROI.
4. Cost Per Opportunity by Program
What it measures: Total ABM spend (ads, content, events, technology, headcount) divided by qualified opportunities generated from ABM-targeted accounts.
Why it predicts revenue: This is the efficiency metric. ABM programs should produce opportunities at a cost that makes economic sense given your deal size and win rate.
How to calculate: Total ABM program spend ÷ Qualified opportunities from ABM accounts
Benchmark math: If your average deal size is $100K and your win rate is 25%, each qualified opportunity is worth $25K in expected revenue. Your cost per opportunity should be well below that: typically $2,000-10,000 per opportunity for mid-market ABM, $5,000-25,000 for enterprise ABM.
If CPO exceeds threshold: Either the program is targeting too many accounts (diluting spend), using too-expensive channels (custom events for Tier 3 accounts), or not generating enough pipeline per account touched.
5. Multi-Threading Depth from ABM
What it measures: The number of unique stakeholders engaged per account through ABM activities before sales engagement begins.
Why it predicts revenue: Enterprise deals close at significantly higher rates when multiple stakeholders are engaged. If ABM warms 3-5 stakeholders before the first sales call, the deal starts with built-in multi-threading that single-threaded outreach can't match. This is especially true when teams combine ABM with signal-based selling to prioritize the right accounts at the right time.
How to measure: Count unique contacts per ABM account that have engaged (opened emails, clicked ads, attended events, downloaded content). Compare multi-threading depth against deal outcomes.
Target: ABM should engage 3+ unique stakeholders per Tier 1 account before sales handoff.
 Filtering signals by type and account tier turns raw engagement data into a decision-ready view of which ABM accounts are showing real buying intent.

“There's been a big focus on hyper personalization and relevance in our outbounding efforts. Salesmotion has been a key partner in hitting our significantly increased meeting targets. What stands out is how simple it is. Reps can log in and get valuable account insights within 30 seconds to a minute.”
Joe DeFrance
VP of Sales, Incredible Health
Building an ABM Dashboard That Drives Decisions
Most ABM dashboards are built for reporting, not decision-making. A decision-oriented dashboard answers four questions:
1. Are we targeting the right accounts?
- ICP fit score distribution of ABM accounts
- Buying signal density across ABM-targeted accounts
- Engagement-to-pipeline conversion by account segment
2. Are our programs working?
- Pipeline velocity for ABM vs. non-ABM accounts
- Cost per opportunity by program type
- Multi-threading depth achieved before sales handoff
3. Is ABM generating incremental revenue?
- Influenced revenue vs. control group
- Win rate comparison: ABM-targeted vs. non-targeted accounts
- Deal size comparison: ABM-influenced vs. non-influenced deals
4. Where should we adjust?
- Tier 1 accounts with high engagement but no pipeline (messaging problem?)
- Accounts with strong account intelligence signals but low engagement (channel problem?)
- Programs with high CPO relative to benchmark (efficiency problem?)
Key Takeaways
- Engagement scores don't predict revenue. An account downloading white papers isn't the same as an account evaluating vendors. Focus on metrics that connect marketing activity to pipeline and revenue outcomes.
- The five metrics that matter: pipeline velocity by tier, engagement-to-pipeline conversion, influenced revenue (measured against a control group), cost per opportunity by program, and multi-threading depth.
- Measure ABM impact incrementally: compare ABM-treated accounts against a control group of similar untreated accounts. The difference, not the total, is ABM's contribution.
- Cost per opportunity should be well below expected revenue per opportunity. If your CPO exceeds 25% of expected deal value, the program economics don't work.
- ABM should accelerate pipeline, not just create it. If ABM-targeted accounts don't move faster through the pipeline than non-targeted accounts, the program is adding cost without adding velocity.
- Build dashboards for decisions, not reporting. Every metric should answer a question that leads to an action: adjust targeting, change messaging, shift budget, or scale a winning program.

“We're no longer fishing. We know who the right customers are, and we can qualify them quickly. Salesmotion has had a direct impact on pipeline quality.”
Andrew Giordano
VP of Global Commercial Operations, Analytic Partners
Frequently Asked Questions
What are the most important ABM metrics?
The five most important ABM metrics are: pipeline velocity by account tier (is ABM accelerating deals?), engagement-to-pipeline conversion (is engagement translating to pipeline?), influenced revenue measured against a control group (is ABM generating incremental revenue?), cost per opportunity by program (is the investment efficient?), and multi-threading depth (is ABM building stakeholder relationships before sales engages?). These metrics connect ABM activity to revenue outcomes rather than measuring marketing vanity metrics.
How do you measure ABM ROI?
Measure ABM ROI by comparing outcomes from ABM-targeted accounts against a control group of comparable accounts that did not receive ABM treatment. Calculate the incremental pipeline, win rate improvement, and revenue generated by ABM-treated accounts beyond what control accounts generated organically. Subtract ABM program costs (technology, ads, content, events, headcount) from the incremental revenue to determine true ROI. This approach avoids both over-attribution (crediting ABM for organic pipeline) and under-attribution (ignoring ABM's contribution).
What is a good engagement-to-pipeline conversion rate for ABM?
Benchmarks vary by program tier: 30-50% for Tier 1 (1:1) programs, 15-25% for Tier 2 (1:few) programs, and 5-10% for Tier 3 (1:many) programs. If conversion rates fall below these benchmarks, investigate targeting (are the accounts truly ICP fit?), messaging (does the content resonate with the buying committee?), and channel mix (are the right stakeholders being reached?). Strong account research at the targeting stage often fixes low conversion rates. Conversion rates above benchmark suggest the program can be scaled with additional budget.
How often should ABM metrics be reviewed?
Review engagement and activity metrics weekly to monitor program health. Review pipeline metrics (engagement-to-pipeline conversion, velocity comparison) monthly to assess whether programs are generating business outcomes. Review ROI and influenced revenue metrics quarterly to evaluate overall ABM program effectiveness and inform budget allocation decisions. Annual reviews should drive strategic decisions about program expansion, contraction, or restructuring.