At Salesforce, I watched AEs with 200+ accounts in their territory treat every single one the same. Equal time, equal effort, equal results: mediocre across the board. The reps who consistently hit President's Club? They had a system. They knew exactly which 15-20 accounts deserved deep attention, which 40 needed steady nurturing, and which 150 could wait. That system is account prioritization, and it's the single biggest lever most sales teams never pull.
The data backs this up at scale. The 2025 Ebsta x Pavilion GTM Benchmarks report, which analyzed $48 billion in pipeline, found that the top 14% of sellers generate 80% of revenue. Meanwhile, 78% of sellers missed quota in 2025. The gap between prioritized and unprioritized selling has never been wider. And Salesforce's own research shows reps spend just 30% of their time actually selling. The rest disappears into admin, internal meetings, and unfocused research across accounts that may never close. Account prioritization fixes this by giving your team a data-backed system for deciding where to invest their limited selling hours.
TL;DR: Account prioritization is the process of ranking your accounts by fit, intent, and engagement to focus selling time on the deals most likely to close. Teams that implement structured prioritization see 10-20% lower cost-to-serve and significantly higher revenue per rep. The key is combining ICP fit scoring with real-time buying signals rather than relying on gut instinct or alphabetical order.
What Account Prioritization Actually Means (and What It Doesn't)
Account prioritization is not account tiering, though the two are related. Tiering is the output. Prioritization is the decision framework that gets you there.
At its core, account prioritization answers one question: "If my reps could only work 20 accounts this quarter, which 20 would generate the most pipeline?" That question forces clarity. It requires you to define what "good" looks like, measure it consistently, and update it as the market shifts.
What it doesn't mean:
- Ignoring small accounts. Prioritization means allocating appropriate effort, not zero effort. Tier 3 accounts still get automated nurture and marketing coverage.
- A one-time exercise. Markets change. Champions leave. Budgets get cut. Any prioritization model that doesn't refresh at least quarterly is already stale.
- Pure firmographic filtering. Company size and industry matter, but they're table stakes. The real signal is in behavior: who's hiring, who's restructuring, who just posted earnings that scream "we need this."
The best account prioritization frameworks combine three layers of data: static fit (firmographics and technographics), dynamic intent (what the account is actively researching or doing), and relationship context (do you have a warm path in?). Miss any one of these and your prioritization is incomplete.

“Salesmotion is instrumental in helping me prioritize net-new accounts, understand their strategic initiatives, and cover more ground. With a lot of green-field accounts, I'm heavily leaning on the AI insights to tier my accounts and focus my time. The platform is incredibly intuitive and easy to use.”
Rob Webster
Enterprise Account Executive, Synthesia
The Account Prioritization Framework: Fit, Signals, and Engagement
Most prioritization models fail because they're either too simple (revenue + industry = score) or too complex (47 weighted variables nobody trusts). The sweet spot is a model with 5-8 factors across three categories, weighted by your specific business. For the mechanics of building and weighting the underlying model, see our full guide to account scoring. This section covers how to apply it to prioritization decisions.
ICP Fit Score (40% of total)
This is your foundation. How closely does this account match your ideal customer profile, the documented shape of your best existing customers?
| Factor | What to Measure | Weight |
|---|---|---|
| Company size | Employee count or revenue band matching your sweet spot | 10% |
| Industry | Primary industry alignment with your strongest verticals | 10% |
| Tech stack | Uses complementary tools (CRM, marketing automation, etc.) | 10% |
| Geography | Region where you have coverage and case studies | 5% |
| Org complexity | Buying committee size signals enterprise readiness | 5% |
The goal here is to filter out accounts that will never buy, no matter how interested they seem. A 50-person startup showing strong intent signals is still a bad Tier 1 account if your average deal size requires 1,000+ employees.
Buying Signal Score (35% of total)
This is where prioritization separates from basic segmentation. Static data tells you who could buy. Signals tell you who's likely buying now.
The signals that matter most for prioritization:
- Leadership changes. A new CRO, VP of Sales, or Head of RevOps almost always triggers a technology evaluation within 6-12 months. Research from Gartner confirms that new sales leaders are prioritizing AI and technology adoption as their first strategic initiative.
- Hiring patterns. When an account posts 5+ SDR roles in a quarter, they're scaling outbound. When they post a RevOps role, they're investing in infrastructure. Both are buying signals.
- Earnings and strategic initiatives. Public companies telegraph their priorities every quarter. When a CEO says "we're investing in go-to-market efficiency" on an earnings call, that's a signal your account intelligence tool should be flagging.
- Funding and M&A. Post-funding companies have budget and urgency. Post-acquisition companies have integration needs and new leadership.
- Technology adoption. Installing a new CRM or marketing automation platform often triggers adjacent purchases within 6 months.
The impact is measurable: trigger-based approaches yield 4x higher conversions and 30% shorter sales cycles compared to static list-based outreach. And signal-personalized emails achieve 18% response rates, a 5.2x improvement over generic outreach, according to Cognism's analysis of B2B outreach data.
The challenge is that these signals live across dozens of sources: LinkedIn, job boards, SEC filings, press releases, podcasts, industry publications. Manually tracking them for more than 20 accounts is unsustainable. You need automated signal monitoring across your entire territory to capture these without drowning reps in manual research.
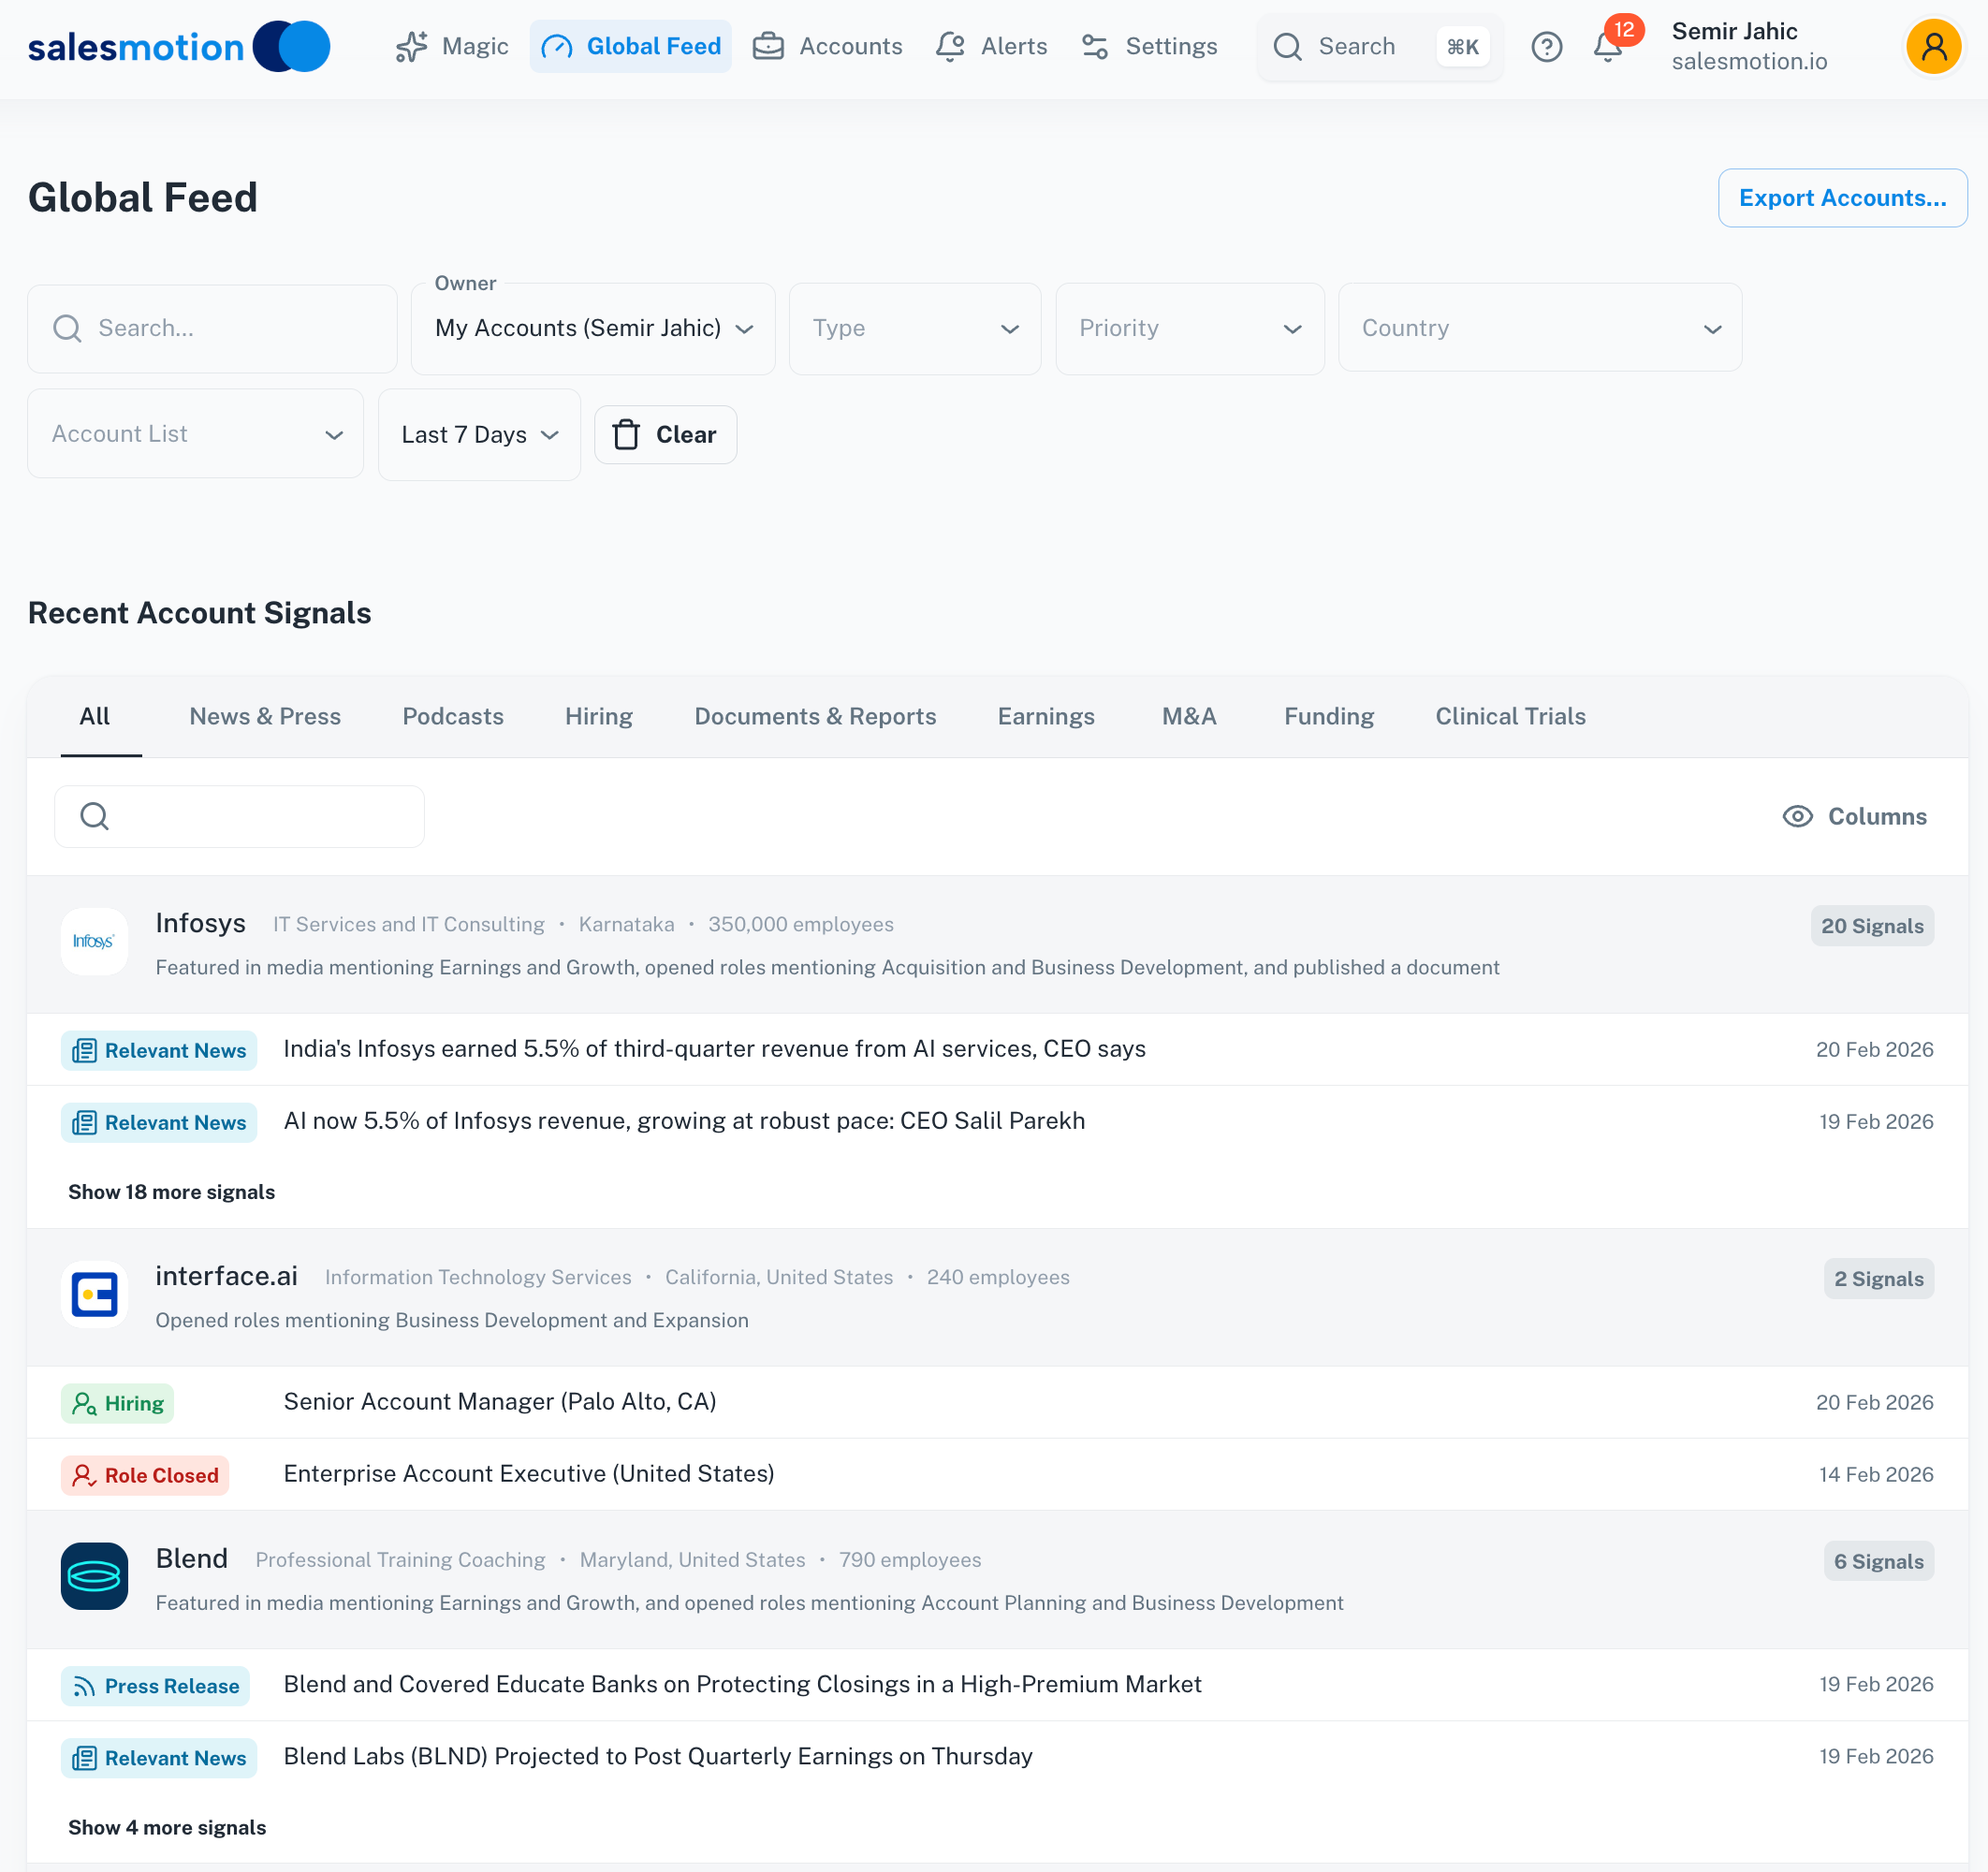 A territory-wide signal feed surfaces the week's earnings mentions, new roles, and press coverage per account, so re-prioritization happens continuously instead of quarterly.
Engagement Score (25% of total)
First-party engagement data rounds out the picture. High fit + strong signals + active engagement = your hottest accounts.
Track these engagement indicators:
- Website visits (especially pricing and demo pages)
- Content downloads and webinar attendance
- Email response rates and reply sentiment
- Meeting attendance and follow-up quality
- Champion activity (are they forwarding your content internally, and are they still in the seat?)
A 2025 study published in Frontiers in AI found that machine learning models combining behavioral engagement data with firmographic signals outperformed traditional scoring by 38% in predicting conversion likelihood. The signal is clear: engagement data isn't just nice to have, it's a core predictor.
See Salesmotion on a real account
Book a 15-minute demo and see how your team saves hours on account research.
How to Prioritize Accounts: A Step-by-Step Walkthrough
Theory is easy. Execution is where most teams stall. Here's the practical workflow for how to prioritize accounts, from first audit to quarterly review.
Step 1: Audit Your Current State
Before building anything new, understand what's working (and what's not) in your current territory allocation.
Pull these reports from your CRM:
- Win rate by account size, industry, and source
- Average deal cycle by segment
- Revenue concentration (what percentage of revenue comes from your top 20% of accounts?)
- Rep time allocation (if tracked) or activity volume per account
Most teams discover something uncomfortable: their reps are spending roughly equal time on accounts regardless of size or fit. A Forrester analysis found that sales teams without structured prioritization waste 25-30% of selling capacity on low-probability accounts.
Step 2: Define Your Scoring Criteria
Using the three-layer framework above (ICP Fit + Signals + Engagement), define 5-8 specific criteria with clear scoring rules. Here's a concrete example:
| Criterion | Score 1 (Low) | Score 3 (Medium) | Score 5 (High) |
|---|---|---|---|
| Employee count | Under 100 | 100-999 | 1,000+ |
| Industry match | Adjacent vertical | Secondary vertical | Primary vertical |
| Tech stack fit | No CRM | Basic CRM | Salesforce or HubSpot |
| Leadership change | None in 12 months | VP-level change | C-suite change in 6 months |
| Hiring velocity | Flat headcount | 5-10% growth | 15%+ growth |
| Engagement | No touchpoints | Content downloads | Demo request or meeting |
Step 3: Score and Tier Your Accounts
Apply your scoring model across your total addressable market. Most teams land on three tiers:
- Tier 1 (Score 35-50): Top 10-15% of accounts. These get dedicated 1:1 plays, custom research, and executive engagement. Cap this at 15-25 accounts per rep.
- Tier 2 (Score 20-34): Next 20-25%. These get semi-personalized outreach, templated research briefs, and regular signal monitoring. 30-50 accounts per rep.
- Tier 3 (Score below 20): Everything else. Automated nurture sequences, marketing-led engagement, and signal-triggered re-prioritization when behavior changes.
Tiering isn't just a leadership exercise. It should be a tool reps actively use to decide where to spend their next hour, especially in green-field territories where no relationship history exists to fall back on.
The numbers matter. According to CaptivateIQ's analysis of account scoring, organizations that limit Tier 1 to 10% of their total accounts see 2.3x higher engagement rates than those who overload the tier. More isn't better. Focus is.
Step 4: Assign Plays by Tier
Each tier needs a defined sales play. Here's what that looks like in practice:
Tier 1 Play: Deep Research + Custom Outreach
- Full account brief before any outreach (company strategy, key initiatives, leadership changes, competitive landscape)
- Multi-threaded engagement across 3-5 stakeholders
- Custom value propositions tied to specific account initiatives
- Weekly signal monitoring for timing triggers
This is where the math changes. What used to take 2-3 hours of manual research per Tier 1 account, toggling between LinkedIn, 10-K filings, Crunchbase, news sites, and ChatGPT, can compress into a 5-minute account brief with the right tooling. Tools like Salesmotion, which monitors 50+ signal types across your territory, make this possible: a team of 10 reps with 20 Tier 1 accounts each goes from 400-600 hours per month of research to under 20.
Tier 2 Play: Signal-Triggered Engagement
- Templated outreach personalized with 2-3 account-specific data points
- Monthly signal review (leadership changes, funding, strategic shifts)
- Automated nurture between active outreach cycles
Tier 3 Play: Automated Nurture
- Marketing-led sequences (content, webinars, events)
- Signal-based promotion: when a Tier 3 account shows a leadership change + engagement spike, it gets automatically promoted to Tier 2 for review
Salesmotion's Take
I watched this problem up close at Salesforce -- reps treating all 200 accounts equally because the research burden made real prioritization impossible. That's why I built Salesmotion: to compress 3 hours of account research into 5 minutes so reps can actually do the prioritization work, not just theorize about it in a QBR slide deck.

Semir Jahic
CEO & Co-Founder, Salesmotion
Step 5: Review and Reprioritize Quarterly
Your prioritization model is a living system. Demandbase recommends resetting scores at the start of each quarter, incorporating:
- New signal data (leadership changes, funding rounds, earnings)
- Win/loss analysis from the previous quarter
- Changes in your own ICP (did you expand into a new vertical? Launch a new product?)
- Rep feedback on account quality
The quarterly review is also when you catch "zombie accounts," Tier 1 accounts that scored high six months ago but have gone dark. Demoting these frees up capacity for accounts that are actively showing intent.
Why Frameworks Break at Scale (and How to Fix It)
Every sales leader has tried to operationalize account prioritization. The frameworks look great in the training deck. Then reality hits.
Hayes Davis, CEO of Gradient Works, laid out the math on why "just work harder" doesn't scale: the combination of meetings, outreach touches, and research at even 2-3x volume exceeds human capacity. Asking a rep to deeply prioritize 200 accounts without systems is asking them to do something physically impossible with the hours in a day.
Here's what actually breaks:
Manual scoring doesn't scale. Scoring 500 accounts across 8 criteria is a spreadsheet nightmare. By the time you finish, the first accounts you scored are already stale. The data changes faster than any human can track.
Signals live outside the CRM. The most predictive buying signals (earnings call language, hiring patterns, executive moves, competitive shifts) don't exist in Salesforce. They're scattered across LinkedIn, job boards, SEC filings, press releases, and news sites. No rep is checking all of these for 200 accounts.
Reps don't update fields. Even with a perfect scoring model in your CRM, it's only as good as the data feeding it. And HubSpot's research shows that 68% of sales professionals cite data entry as their most time-consuming non-selling task. If the system depends on reps manually updating account intelligence, it will decay within weeks.
Point-in-time snapshots miss dynamic signals. A quarterly scoring exercise captures a moment in time. But buying signals fire continuously. A VP of Sales hired in January might not show up in your Q2 scoring refresh until April, by which time three competitors have already reached out.
The fix is continuous, automated monitoring. This is the core of signal-based selling: instead of quarterly scoring exercises, the prioritization model updates in real-time as signals fire. When an account intelligence platform detects a leadership change at a target account, the account score updates automatically. When earnings commentary signals a strategic shift, the account gets flagged for rep review. The model stays fresh without requiring manual maintenance.
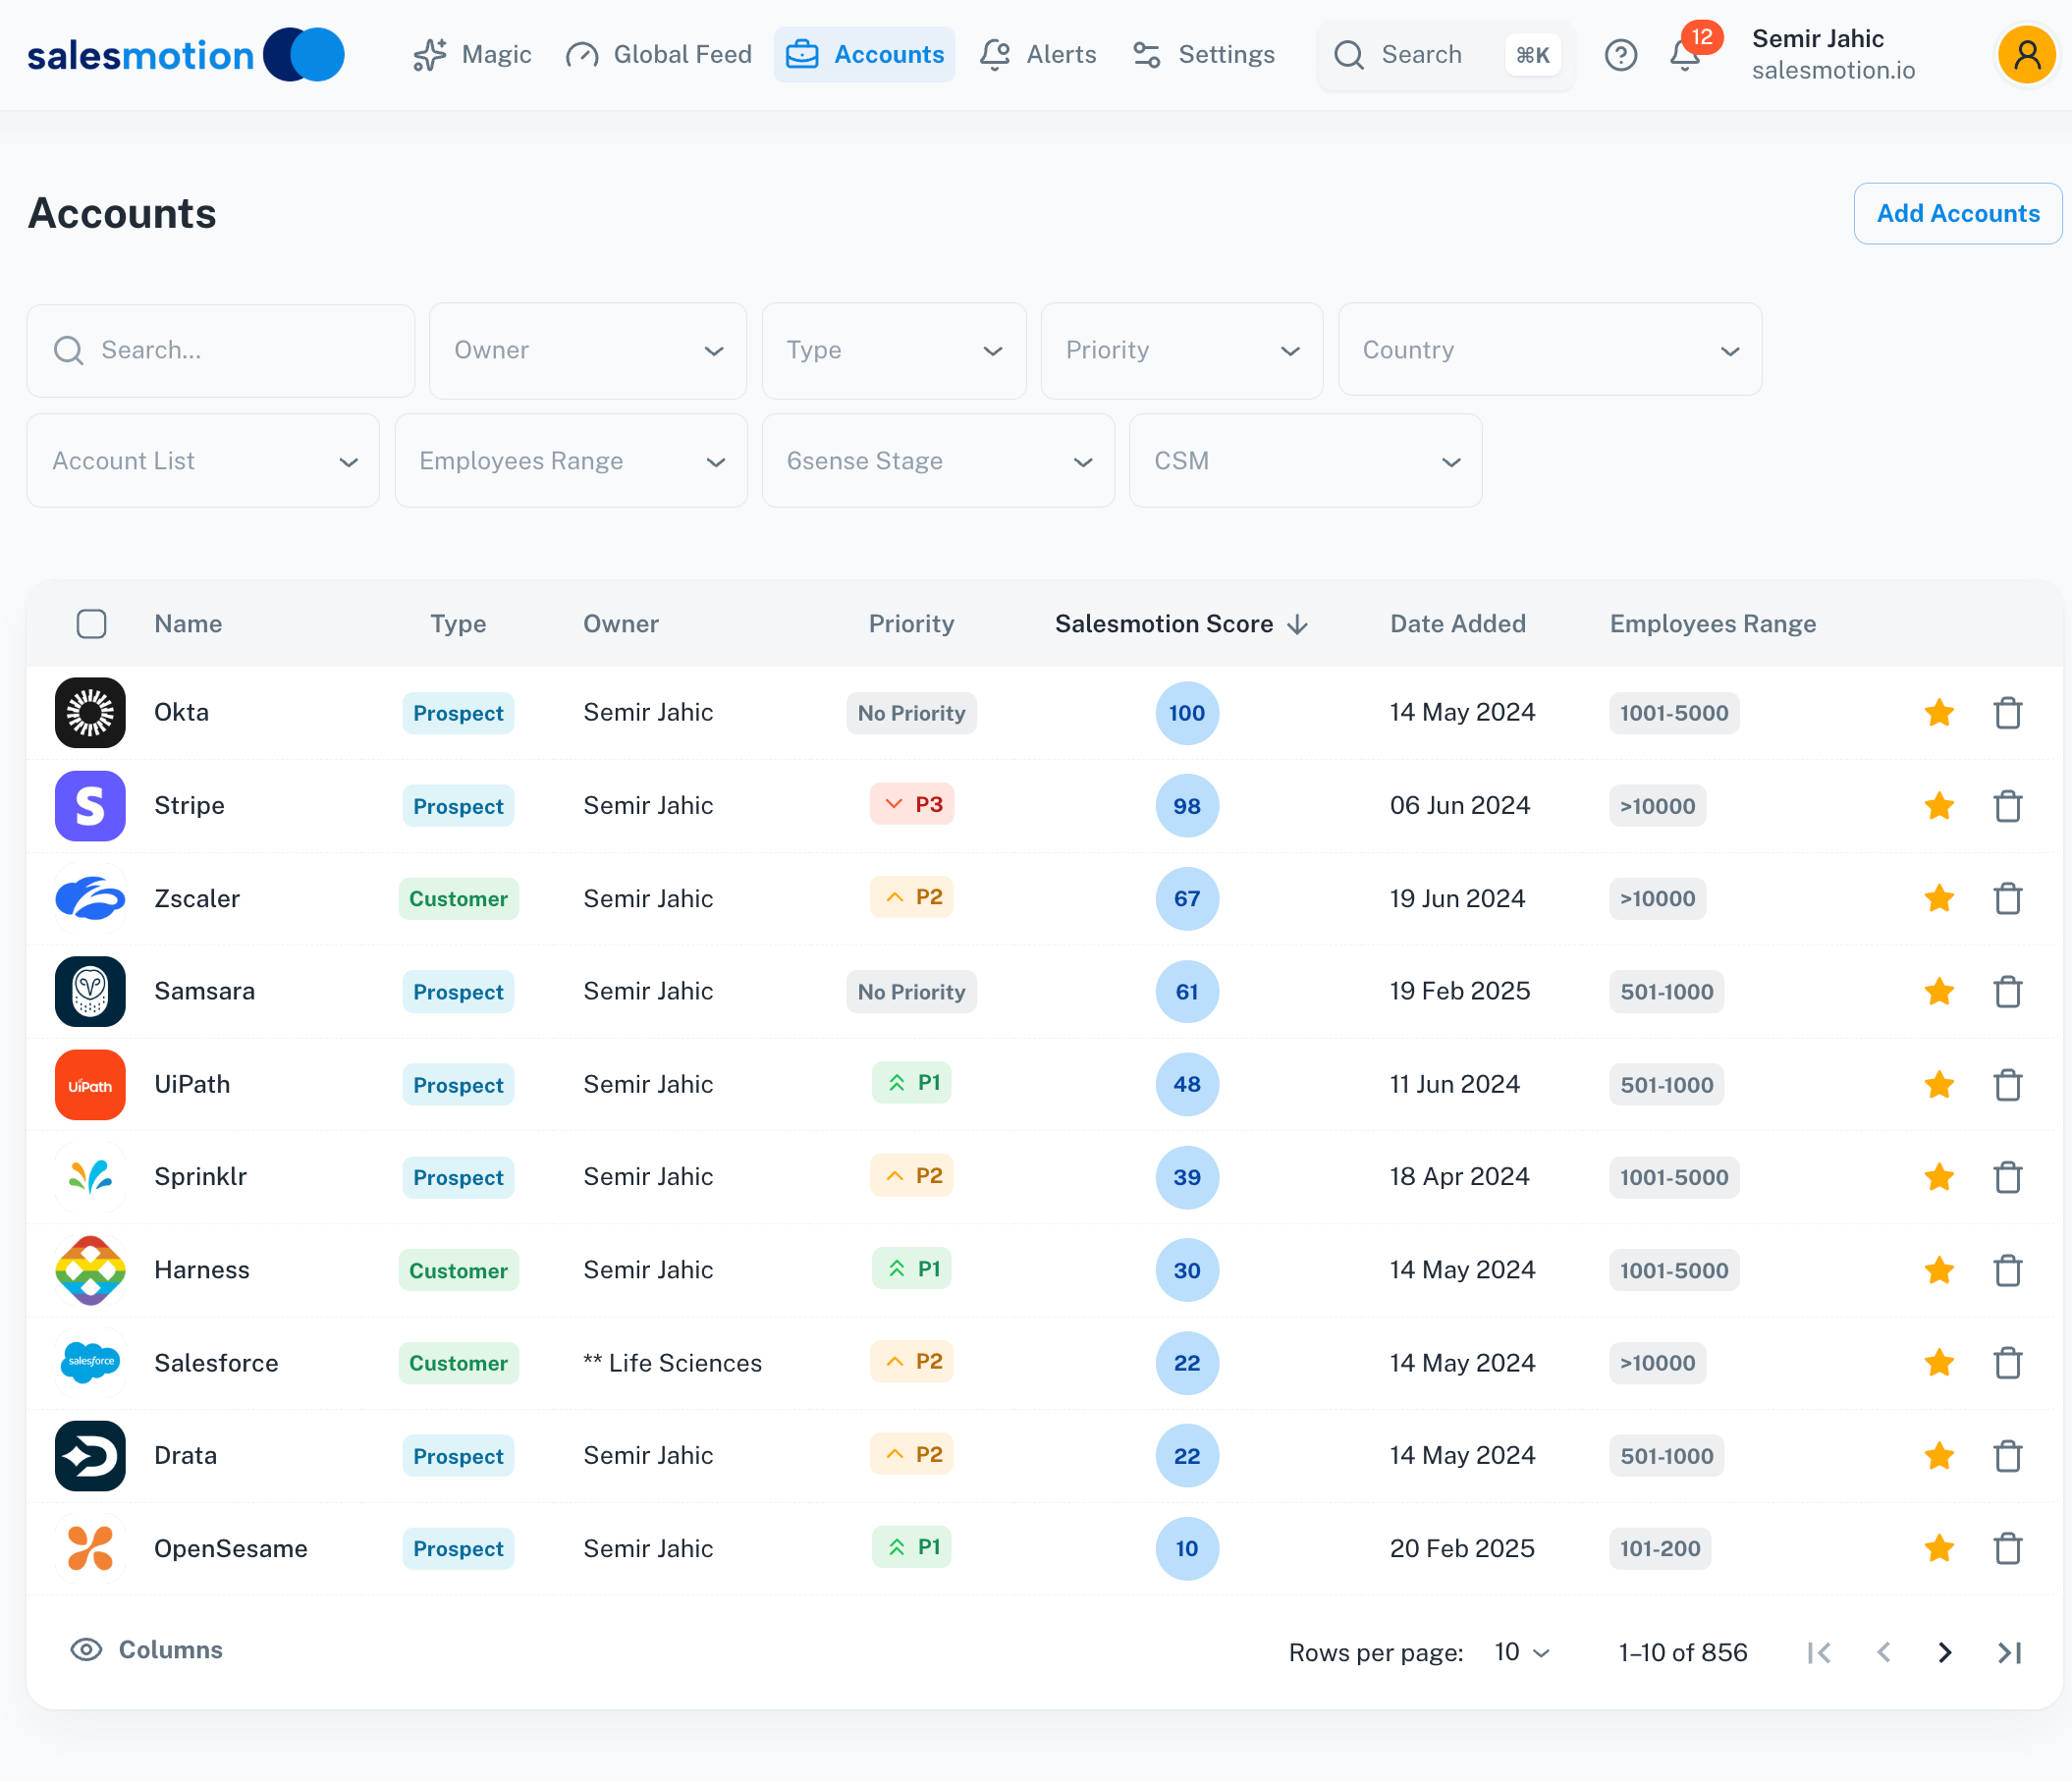 An account intelligence dashboard scores and prioritizes accounts based on real-time signals, ICP fit, and engagement data.

“We're saving about 6 hours per week per seller on account research alone. That's time they can reinvest in actually selling.”
Derek Rosen
Director, Strategic Accounts, Guild Education
Measuring the Impact of Account Prioritization
You need to track whether your prioritization model is actually working. These are the metrics that matter:
| Metric | What It Tells You | Target Improvement |
|---|---|---|
| Win rate by tier | Whether your tier definitions are accurate | Tier 1 win rate should be 2-3x Tier 3 |
| Average deal size by tier | Whether you're allocating effort to the right accounts | Tier 1 deals should be 3-5x larger |
| Pipeline velocity by tier | Whether high-priority accounts move faster | 20-30% faster for Tier 1 |
| Rep time allocation | Whether reps are actually following the model | 60%+ of time on Tier 1 and 2 |
| Tier promotion rate | Whether signals are catching accounts early | 5-10% of Tier 3 accounts should promote per quarter |
A 2025 analysis from MarketingLTB found that companies with structured account prioritization saw 28% shorter sales cycles and 88% of teams reported better lead prioritization. The data is consistent: structured beats unstructured, every time.
Key Takeaways
- Account prioritization is a decision framework, not a one-time sorting exercise. It should combine ICP fit (40%), buying signals (35%), and engagement data (25%) into a living score that updates as signals fire.
- Limit Tier 1 to 10-15% of your territory. Focus beats breadth. Organizations that overload Tier 1 see engagement rates drop by more than half.
- The biggest failure mode is manual maintenance. Scoring 500 accounts in a spreadsheet is already stale by the time you finish. Automate signal monitoring to keep scores current.
- Every tier needs a defined sales play. Tier 1 gets deep research and custom outreach. Tier 2 gets signal-triggered engagement. Tier 3 gets automated nurture with promotion triggers.
- Review and reprioritize quarterly, but monitor signals continuously. The reps who catch a leadership change in week 1 have a 3-month head start over those who wait for the quarterly refresh.
- Account intelligence platforms compress multi-hour research into minutes per account, making Tier 1 deep-research plays actually sustainable at scale.
Frequently Asked Questions
How do you prioritize accounts?
Prioritize accounts by scoring each one on three layers: ICP fit (40%), live buying signals like leadership changes and hiring surges (35%), and engagement (25%). Rank the results, cap Tier 1 at 15-25 accounts per rep, assign a defined play to each tier, and re-score continuously as new signals fire rather than waiting for a quarterly refresh.
How many accounts should a sales rep have in Tier 1?
Most high-performing teams cap Tier 1 at 15-25 accounts per rep. According to Mutiny's analysis, top ABM programs limit Priority 1 accounts to around 10, with the logic that a rep can only maintain deep, research-driven relationships with a small number of accounts simultaneously. The exact number depends on your deal complexity and sales cycle length, but the principle holds: if every account is Tier 1, no account is Tier 1.
What's the difference between account prioritization and lead scoring?
Lead scoring evaluates individual contacts based on demographic fit and behavioral signals (email opens, page visits, form fills). Account prioritization operates at the company level, evaluating organizational fit, buying signals, and aggregate engagement across the entire buying committee. In B2B enterprise sales, account-level prioritization matters more because purchase decisions involve 6-10 stakeholders on average, according to Gartner research. A single lead score tells you about one person. Account prioritization tells you about the company's likelihood and readiness to buy.
How often should you update account prioritization scores?
The scoring model itself should be reviewed quarterly, but individual account scores should update continuously based on real-time signals. A Demandbase analysis recommends resetting and recalibrating at the start of each business quarter, while monitoring for tier-changing signals (leadership changes, funding, strategic shifts) on an ongoing basis. Teams that only score quarterly miss 60-90 days of signal data, giving competitors who monitor continuously a significant first-mover advantage.
Can small sales teams benefit from account prioritization?
Absolutely. Prioritization is arguably more important for small teams because they have fewer reps and less margin for wasted effort. A team of 3 reps cannot afford to spread across 500 accounts equally. Even a simple scoring model using ICP fit + one signal source (like leadership changes) dramatically improves focus. The Alexander Group's research shows that account prioritization and segmentation provide the foundation for GTM planning regardless of team size, with the revenue-potential algorithm approach scaling down effectively to small, focused teams. Tooling does not require enterprise procurement either: Salesmotion's individual plan is $85/mo, self-serve monthly with no annual commitment, and team plans use custom pricing with unlimited users on team plans.
What data sources are needed for effective account prioritization?
At minimum, you need CRM data (firmographics, historical deal data), engagement data (marketing automation or website analytics), and one external signal source. The most predictive models add intent data, hiring signals, earnings data, and competitive intelligence. According to a Frontiers in AI study, models combining behavioral signals with firmographic data outperformed single-source models by 38% in conversion prediction. The practical challenge is aggregating these sources into a single score without requiring reps to manually track multiple platforms. Account intelligence tools that consolidate signal sources into one view solve this aggregation problem.