Planning a long road trip? You wouldn't pack just enough gas to barely reach your destination. You'd account for detours, traffic, and unexpected coffee stops.
Healthy pipeline coverage is your sales engine’s fuel reserve. It's the critical buffer that ensures you hit your revenue targets, even when deals slip, shrink, or fall through.
What Is Healthy Pipeline Coverage?
Pipeline coverage is a simple metric measuring the ratio of your total qualified deal value against your sales quota. Think of it as your sales team's early warning system.
It answers the one question that keeps every sales leader up at night: Do we have enough deals in the works to realistically hit our number?
This metric moves you from reactive, end-of-quarter scrambling to proactive, predictable revenue growth. Instead of just hoping for the best, you build a system that can withstand the ups and downs of the B2B sales cycle. Understanding this concept is the first step toward building a resilient sales organization. For a foundational overview, see our guide on pipeline coverage and how it connects to predictable revenue.
Of course, your coverage ratio is only as reliable as the pipeline it's built on. A clear understanding of your deal flow is foundational. If deals constantly get stuck, your coverage ratio becomes a vanity metric. For a deeper dive, review best practices for optimizing your pipeline sales stages.
The Gold Standard Ratio
For most B2B sales teams, a 3:1 to 4:1 pipeline coverage ratio is the industry gold standard. Simply put, for every dollar in your quota, you should have three to four dollars sitting in your qualified pipeline.
This isn't an arbitrary number. It’s a battle-tested benchmark that accounts for the reality that not every deal will cross the finish line.
But a high ratio alone doesn't guarantee a win. A pipeline can look massive but be stuffed with low-quality leads or deals that haven't moved in months. This is where the "health" of your pipeline becomes just as important as the "coverage."
True pipeline health requires measuring what's real, not what's reassuring. An inflated pipeline gives the illusion of momentum while hiding massive risk. The best leaders shift from managing numbers to managing performance.
Beyond the Basic Ratio
To get a real handle on your pipeline's health, look beyond a single, blended number. A robust approach means analyzing the pipeline from multiple angles to get the complete picture.
- Deal Velocity: How quickly do opportunities move from one stage to the next? Stagnant deals artificially inflate your coverage ratio.
- Win Rates: What percentage of opportunities does your team close? A team with a lower win rate needs a higher coverage ratio to compensate.
- Deal Size Consistency: Is your pipeline dangerously dependent on a few massive "whale" deals, or is it balanced? Over-reliance on huge deals introduces significant risk.
- Pipeline Quality: Are your deals well-qualified? A smaller pipeline filled with high-intent buyers is more valuable than a huge one built on wishful thinking.
Focusing on these elements ensures your coverage number is a true reflection of your team's ability to hit its goals. Mastering the structure and flow of your opportunities is key, and our guide on sales pipeline stages can provide a solid foundation.
See Salesmotion in action
Take a self-guided interactive tour — no signup required.
How To Calculate Your Pipeline Coverage Ratio
Moving from ideas to numbers is where you gain control over your team's performance. Calculating your pipeline coverage ratio is the first practical step toward building a predictable revenue engine. The good news? It’s simpler than it sounds and gives you a powerful snapshot of your forecast.
The formula is refreshingly straightforward.
Pipeline Coverage Ratio = Total Value of Your Sales Pipeline / Your Sales Target
Let's put it into practice. Say your team has a quarterly sales quota of $250,000, and the total value of all qualified opportunities in your pipeline is $1,000,000. The math looks like this:
$1,000,000 (Pipeline) / $250,000 (Quota) = 4
In this scenario, you have a 4x pipeline coverage ratio. On the surface, you're in a great spot, aligning with the industry benchmark of 3x to 4x.
This chart helps visualize how these pieces—quota, pipeline, and the resulting coverage—fit together, giving you a clear picture of your sales health at a glance.
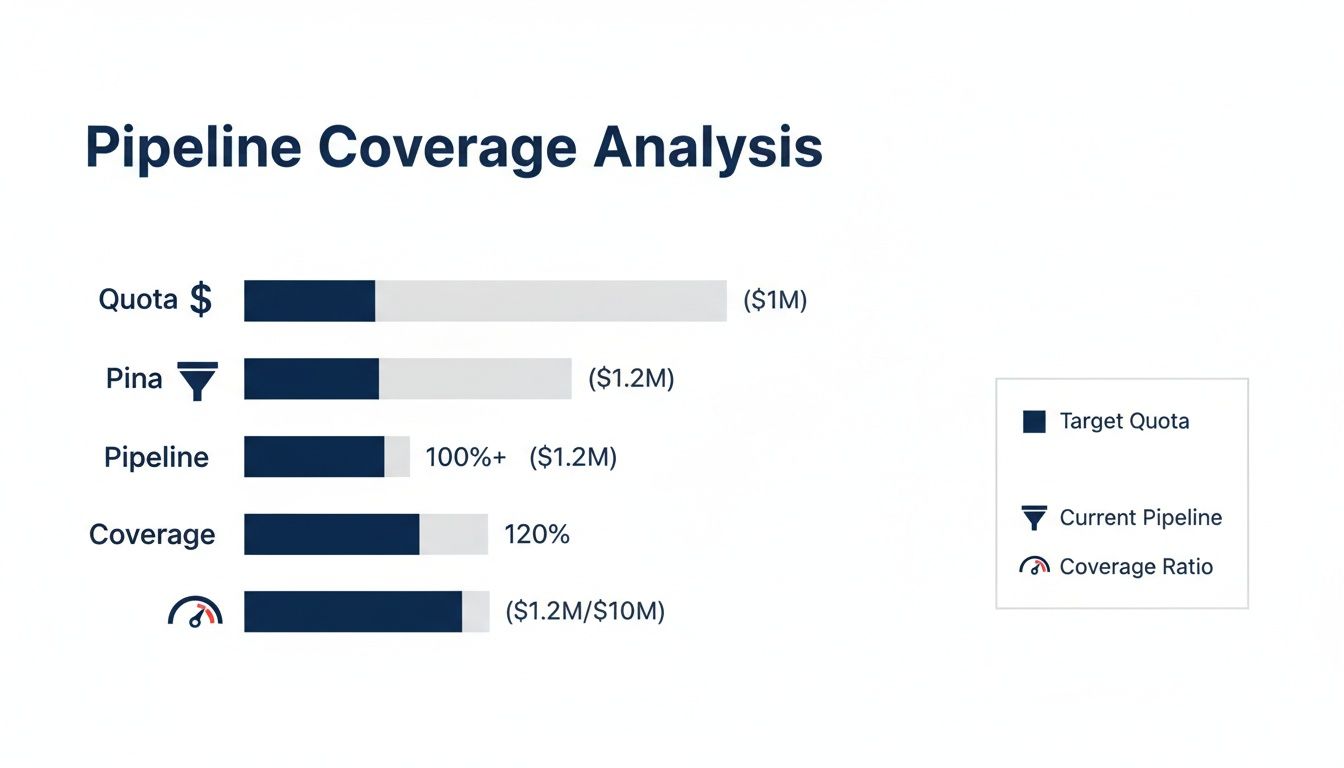
This visual makes it easy to see if your pipeline value is enough to cover your quota, acting as a quick diagnostic for your sales forecast.
Adding Nuance with Win Rates
But wait. The basic formula has a flaw: it treats every deal as equal, and we know that's not the case. True accuracy comes from layering in your historical win rate. This number tells you what percentage of qualified opportunities your team actually closes.
Your win rate directly dictates how much coverage you truly need. A team that closes a high percentage of its deals can operate with a leaner pipeline, while a team with a lower win rate needs a larger buffer.
- A team with a 20% win rate needs a 5x coverage ratio just to feel safe.
- A team closing deals at a 40% clip can succeed with a much tighter 2.5x coverage ratio.
This context is everything. Aiming for a generic 3x ratio without understanding your team's specific performance can create a false sense of security. If you need a refresher on this metric, our guide on how to calculate win rate offers a detailed walkthrough.
Setting Benchmarks Based on Performance
The link between win rates and required coverage isn't just theory; it's a mathematical reality. Understanding this relationship lets you set realistic, data-driven targets tailored to your team's actual performance.
The table below shows how the ideal target for healthy pipeline coverage shifts based on your team's win rate.
Pipeline Coverage Benchmarks By Win Rate
| Historical Win Rate | Required Pipeline Coverage Ratio | Example Scenario |
|---|---|---|
| 10% | 10x | For every $1 in quota, you need $10 in the pipeline. This often points to issues with lead qualification. |
| 25% | 4x | A common and healthy benchmark for many B2B sales teams, aligning with the industry standard. |
| 33% | 3x | A strong win rate allows for a more efficient pipeline, requiring less volume to hit revenue targets. |
| 50% | 2x | Elite teams with high close rates can confidently hit their numbers with much lower, highly qualified coverage. |
As you can see, there is no one-size-fits-all answer. The "right" pipeline coverage ratio depends entirely on how effectively your team turns opportunities into closed-won deals.
The Adjusted Pipeline Coverage Ratio
For even greater precision, many top sales leaders use an adjusted pipeline coverage ratio. This advanced calculation weighs each deal's value based on its stage in the sales cycle. After all, a deal in the final negotiation stage has a much higher probability of closing than one in discovery.
Here’s a simple way to approach it:
- Assign Probabilities: Based on historical data, assign a closing probability to each stage of your sales process (e.g., Discovery = 10%, Proposal = 60%).
- Calculate Weighted Value: Multiply each deal's value by the probability of its current stage. A $50,000 deal in a 20% stage has a weighted value of $10,000.
- Sum It Up: Add the weighted values of all deals in your pipeline.
- Calculate the Ratio: Divide your total weighted pipeline value by your sales quota.
While this method requires solid data hygiene, it provides a much more realistic forecast. It helps you avoid the trap of an inflated pipeline filled with early-stage, low-probability deals, giving you a truer measure of your healthy pipeline coverage.

“Salesmotion is instrumental in helping me prioritize net-new accounts, understand their strategic initiatives, and cover more ground. With a lot of green-field accounts, I'm heavily leaning on the AI insights to tier my accounts and focus my time. The platform is incredibly intuitive and easy to use.”
Rob Webster
Enterprise Account Executive, Synthesia
Key Factors That Influence Pipeline Health
A big pipeline coverage ratio looks great on a dashboard, but it's only half the story. If that pipeline is clogged with stagnant, low-quality deals, it creates a dangerous false sense of security. Your forecast might look strong, but you're hiding risk right under the surface.
True pipeline health isn't about volume. It's about the quality and momentum of the deals moving through it.
Think of your pipeline as a river. A healthy river flows consistently. A high coverage ratio might mean the river is wide, but if it's full of stagnant pools, it’s not really moving. To get a real picture of its health, we need to look past the surface and measure the current.

This requires a mental shift from quantity to quality. A smaller, well-qualified pipeline is infinitely more valuable than a massive one built on hope. The best sales leaders know this and focus on three core pillars that reveal the real story.
The Three Pillars of a Quality Pipeline
To understand what’s going on, you have to track more than just the total dollar value. These three metrics work together to give you a complete view of your sales engine's performance.
-
Deal Velocity: This is the speedometer for your sales cycle. It measures how fast an opportunity moves from creation to close. Slow deal velocity is a huge red flag, often signaling that deals are stuck or reps don't have a compelling "why now?" to create urgency.
-
Win Rates: As we covered, your win rate is the ultimate report card on your team's effectiveness. A healthy pipeline consistently produces wins. If that win rate is low or dropping, you’ve likely got issues with qualification, messaging, or your competitive positioning.
-
Deal Size Consistency: Is your entire forecast hanging on one or two "whale" deals? Big deals are exciting, but relying on them introduces serious risk. A healthy pipeline has a balanced mix of deal sizes, so a single loss won’t derail the quarter.
Tracking these pillars helps you move from managing numbers to actively managing performance. For a deeper dive into the first pillar, our guide on improving pipeline velocity offers practical strategies to get your deals moving faster.
Diagnosing Common Pipeline Diseases
When these metrics are off, it's usually a symptom of a deeper problem. A sales leader has to find the root cause of poor pipeline health. Two of the most common "diseases" are pipeline bloat and pipeline anemia.
Pipeline Bloat is what happens when your pipeline gets clogged with stagnant, low-quality opportunities. These "ghost deals" show little to no buyer engagement but artificially inflate your coverage ratio, creating the illusion of momentum while hiding risk.
The main symptoms? Deals sitting in the same stage for months and close dates that keep getting pushed out. This often happens when reps are pressured to maintain a high coverage ratio and become reluctant to disqualify deals, even the ones that have gone cold.
On the other end of the spectrum is a different, but equally dangerous, problem.
The Threat of Pipeline Anemia
Pipeline Anemia is the opposite issue: your pipeline is starved for new, qualified deals. This is the direct result of inconsistent prospecting, leading to a thin funnel that can't support your revenue goals.
The most obvious symptom is a low pipeline coverage ratio, often well below the 3x benchmark. Teams suffering from anemia often live in a "feast or famine" cycle, scrambling to close a few deals at the end of a quarter and then starting the next one from scratch.
This condition comes from one thing: neglecting top-of-funnel activities. Top-performing sales teams make prospecting a continuous habit, not a periodic task. They ensure they always have more opportunities entering the pipeline than they are closing. A proactive approach to pipeline generation is the only reliable cure, ensuring a steady flow of opportunities to maintain healthy pipeline coverage and drive predictable growth.
How To Diagnose Common Pipeline Problems
Even a pipeline with a great coverage ratio can hide serious problems. As a sales leader, you need a toolkit to spot and fix common issues before they derail your quarter. Ignoring these warning signs is a recipe for missed targets.
The key is to move from observing symptoms to pinpointing the root cause. A stalled deal is a symptom of a deeper issue. Is it a qualification problem? A failure to build urgency? By asking the right questions, you can turn challenges into solvable problems and maintain truly healthy pipeline coverage.
Here’s a quick-reference table to connect common pipeline symptoms with their likely causes.
Common Pipeline Problems And Their Root Causes
| Symptom | Potential Root Cause | Diagnostic Question |
|---|---|---|
| "Feast or Famine" Cycles | Inconsistent prospecting activity; over-reliance on one lead source. | Is prospecting a daily habit or something we only do when the pipeline looks empty? |
| Mid-Funnel Stalls | Weak qualification; lack of urgency; single-threading in the account. | Do we have a clear "why now?" for the buyer, or are we just another nice-to-have? |
| Inaccurate Forecasts | Poor CRM data; "ghost deals" inflating the numbers. | Are the close dates in our CRM based on reality, or are they just hopeful placeholders? |
| Low Win Rates | Ineffective discovery; failure to align with business value; poor competitive positioning. | Can the prospect clearly articulate the ROI of our solution back to us? |
| Deals Slipping Quarters | Lack of access to the Economic Buyer; no clear decision process agreed upon. | Have we confirmed the buyer's internal process for signing off on this purchase? |
Use this as a starting point. When you see a symptom, dig into the potential causes with your team to find out what's really going on.
Inconsistent Pipeline Generation
One of the most common ailments is an unpredictable flow of new opportunities. This creates a dangerous "feast or famine" cycle, where your team closes a handful of deals and then has to start the next period from a dead stop. This is a classic symptom of pipeline anemia.
To diagnose this, ask your team:
- Is prospecting a daily habit or just a periodic task? Top performers weave prospecting into their daily workflow, ensuring a steady stream of new leads.
- Are we leaning too heavily on inbound leads? A healthy blend of inbound and outbound activity builds a more resilient and predictable funnel.
- When was the last time we refreshed our target account list? Stale lists lead to stale outreach and diminishing returns.
A consistent top-of-funnel motion is the only cure. You always need more opportunities coming in than you have closing out to keep growth on track.
High Stall Rates in the Mid-Funnel
Perhaps the most frustrating problem is the "mid-funnel clog." This is where deals look promising but then lose all momentum and sit in the same stage for months. These "ghost deals" artificially inflate your coverage ratio while masking a serious lack of real buyer engagement.
These stalled opportunities are often the biggest culprits behind inaccurate forecasts. They create the illusion of a full pipeline, but without genuine momentum, they represent significant hidden risk.
When you see deals getting stuck, dig deeper with questions like these:
- Do we have a compelling "why now?" trigger? If there's no urgency, the buyer has no reason to move forward.
- Are we effectively multi-threading? Relying on a single champion is a massive risk. If that one contact leaves, the deal can die instantly.
- Is the business value clearly defined and agreed upon? If the prospect can't articulate the ROI of your solution, that deal is on shaky ground.
Poor Data and CRM Hygiene
You can't fix what you can't see. Inaccurate or incomplete data in your CRM is like flying blind. It makes it impossible to generate a reliable forecast, identify trends, or accurately measure performance. Without clean data, your pipeline coverage ratio becomes a meaningless number.
This problem often flies under the radar but has a massive impact. For a deeper dive, our guide on improving CRM hygiene offers practical steps to clean up your data and build trust in your reporting.
To check the health of your data, consider these points:
- Are close dates realistic or just placeholders? Reps pushing close dates out quarter after quarter is a classic sign of a dead deal.
- Is critical information (budget, authority, timeline) consistently captured? Missing data often means the deal wasn't properly qualified.
- When was the last time we audited the pipeline to remove dead deals? Regular clean-ups are essential to ensure your forecast is based on reality, not hope.

“The Business Development team gets 80 to 90 percent of what they need in 15 minutes. That is a complete shift in how our reps work.”
Andrew Giordano
VP of Global Commercial Operations, Analytic Partners
Actionable Strategies to Build a Healthy Pipeline
Knowing you have a pipeline problem is one thing. Building one that delivers predictable revenue is another. It's time to move from diagnosis to action with specific, repeatable strategies that create and sustain momentum. This is about putting signal-driven tactics to work.
A healthy pipeline isn't an accident. It's the result of disciplined, proactive workflows designed to spot opportunities and engage them with total relevance. The goal isn't a mad dash at the end of the quarter, but a steady, reliable flow of qualified deals.
To build this kind of robust pipeline, it's critical to implement a practical strategy for lead generation that drives growth from the start. This foundational work ensures your top-of-funnel is always filled with quality prospects.
Use Always-On Account Monitoring
The most effective path to a healthy pipeline is a constant stream of new, qualified opportunities. Always-on Account Monitoring is a workflow that automates this by tracking key signals across your target accounts 24/7. This simple shift moves your team from reactive, cold prospecting to proactive, warm engagement.
Instead of calling into a vacuum, your reps get alerted to real-world business triggers the moment they happen. These triggers give you the perfect "why now" to start a meaningful conversation.
Key triggers you should be tracking include:
- Funding Announcements: Fresh capital almost always means new projects and a bigger budget.
- Executive Moves: A new leader will often re-evaluate existing tools and strategies, creating a window of opportunity.
- Product Launches: A major launch can signal a shift in company direction or a need for supporting tech.
- Negative Earnings Reports: Poor financial results can kickstart a search for efficiency tools or cost-saving solutions.
By acting on these signals, reps can engage accounts with timely context, which dramatically increases the odds of creating a real opportunity.
Deploy Trigger-Based Sequences
Once you spot a compelling trigger, you have to act with speed and precision. A Trigger-based Sequence is a pre-built outreach campaign tailored to a specific business signal. This approach ensures your messaging is never generic and always hits the mark.
For example, when a target account announces a major expansion, you can immediately launch a sequence that speaks directly to the challenges of that specific move.
This method gets your team away from one-size-fits-all templates and into value-driven outreach. It establishes a powerful "why now" from the first touchpoint, which is critical for boosting deal velocity.
This strategy ensures every interaction is rooted in a relevant event in the prospect's world. Your outreach will stand out in a crowded inbox, and you'll see a direct improvement in the quality of deals entering your pipeline.
De-Risk Deals with Strategic Account Planning
Even the most promising deals can stall without strategic management. Strategic Account Planning isn't a one-time document; it's a continuous process of mapping key stakeholders, spotting potential risks, and building a clear path to close.
A living account plan, constantly updated with fresh signals, keeps your team aligned and proactive. When you see a key champion's engagement drop on LinkedIn or a new executive gets hired, you can adjust your strategy on the fly.
This is where multi-threading becomes essential. Relying on a single point of contact is one of the biggest risks in a complex sale. If your champion leaves, the deal can go cold instantly.
A multi-threaded approach means building relationships with multiple stakeholders across different departments and seniority levels. This insulates your deal from unexpected changes and gives you a deeper understanding of the buyer's organization. It's a non-negotiable tactic for de-risking major deals and keeping your pipeline healthy.
Using AI to Maintain Pipeline Health
Modern B2B sales teams can't ignore technology's role in pipeline health. Manually tracking accounts, digging for trigger events, and personalizing every outreach at scale leads to inconsistent results. AI-powered account intelligence has shifted from a luxury to a necessity for any team chasing predictable growth.
Technology can connect the dots for you. By taking on the grunt work of research, AI transforms overwhelming signal overload—all that noise from news and social media—into actionable insights. This directly fuels a more robust pipeline, solving the challenge of building healthy pipeline coverage at scale.

From Manual Effort to Automated Insight
Think about the hours your reps burn digging through press releases and scrolling through LinkedIn. This "manual research tax" is a massive drain on productivity—time that could be spent selling. AI automates this entire process, acting like a tireless analyst for every one of your target accounts.
The real value isn't just saving time; it's catching critical buying signals the moment they happen.
- Automated Research: Instead of reps piecing together context, AI constantly monitors your accounts and delivers the "so what?" directly to them.
- Real-time Alerts: Your team gets instant notifications on key triggers—like a funding announcement or a key executive hire—allowing for immediate, relevant outreach.
- Signal Prioritization: AI helps distinguish between interesting news and a genuine sales trigger, ensuring reps focus their energy on the accounts most likely to convert.
This shift empowers your team to move faster, act with greater precision, and consistently engage buyers with a compelling reason to talk.
Scaling Personalization and Perfecting Timing
The end goal is simple: enable your reps to have more timely, relevant conversations. Generic outreach is dead in complex B2B sales. AI provides the specific context needed to scale personalization without burning out your team.
For instance, when an AI platform flags that a target account just launched a new product, it doesn't just forward the news. It provides the context your rep needs to craft a message that connects your solution to the specific challenges of that launch.
By using AI to automate manual tasks and surface timely triggers, sales teams can ensure reps are always focused on the right accounts, at the right time, with the right message. This is how you build a pipeline based on real activity, not wishful thinking.
This data-driven approach directly impacts your most important pipeline health metrics. It improves response rates, boosts deal velocity by establishing a strong "why now," and ultimately increases the quality of opportunities entering your funnel.
Ensuring Reps Focus on What Matters
Maintaining a healthy pipeline comes down to focus. AI gives reps a clear, data-backed path, guiding them toward accounts showing the strongest buying signals. This prevents them from wasting time on low-probability deals and ensures their efforts are always aligned with revenue goals.
This focus is driven by:
- Signal-based Scoring: Prioritizing accounts based on recent activity and how well they fit your ideal profile.
- Actionable Context: Not just dumping data on reps, but explaining why it matters and suggesting next steps.
- Workflow Integration: Pushing alerts and insights directly into the tools your team already uses, like your CRM or Slack.
By arming your team with these capabilities, you create a system where building and maintaining healthy pipeline coverage becomes a predictable, scalable process instead of a constant, manual struggle.
Key Takeaways
- Healthy pipeline coverage is the ratio of total qualified deal value to your sales quota, with the industry gold standard being a 3:1 to 4:1 ratio to account for deals that will inevitably slip, shrink, or fall through.
- A high coverage ratio is meaningless if the underlying pipeline is unhealthy -- focus on pipeline quality by ensuring deals are properly qualified, actively progressing, and connected to genuine buying intent.
- Consistent top-of-funnel activity is the foundation of healthy coverage, requiring dedicated prospecting time, multi-channel outreach, and a steady flow of new opportunities to replace deals that close or drop out.
- Signal-based prospecting that targets accounts showing real buying signals like funding rounds, executive hires, or competitive dissatisfaction generates higher-quality pipeline than generic outbound volume.
- AI-powered tools can automate pipeline health monitoring, flag at-risk deals, and surface high-priority accounts with real-time buying signals, turning pipeline management from a manual struggle into a predictable, scalable process.
Got Questions? We've Got Answers
Still have questions about pipeline coverage? Let's clear up some of the most common ones we hear from B2B sales leaders.
What Is a Good Pipeline Coverage Ratio?
The classic benchmark is 3x to 4x—meaning you should have $3 to $4 in your pipeline for every $1 of your quota. But that's just a starting point.
The right number for your team comes down to your historical win rate. If your team closes deals at a 50% clip, a 2x ratio might be all you need. If your team has a 20% win rate, you'll probably need a 5x ratio or higher. The best practice is to stop chasing generic benchmarks and tailor your target to your actual performance data.
How Often Should I Review My Pipeline?
Make it a weekly ritual. Pipeline reviews aren't just for the end-of-month scramble.
A consistent, weekly cadence is your best defense against surprises. It lets you spot deals that are starting to stall, find coaching moments for your reps, and keep your forecast grounded in reality. Regular check-ins are what stop "ghost deals" from clogging your funnel and giving you a false sense of security.
What Is the Difference Between Pipeline Coverage and Pipeline Health?
Great question. Think of it this way: pipeline coverage is the quantity of water in a river, while pipeline health is the quality and speed of its flow.
A huge coverage ratio means you have a wide river, but it tells you nothing about whether that water is actually moving or just stagnant. A truly healthy pipeline needs both—enough volume to hit your goals and strong momentum, which you measure with things like deal velocity and win rates.
Can a Pipeline Be Too Big?
Absolutely. It’s a classic case of "pipeline bloat," and it's more dangerous than it sounds.
This happens when your pipeline is stuffed with low-quality, unqualified, or dead deals. It makes your coverage ratio look fantastic on a slide deck but masks a ton of risk because few of those deals have a real shot at closing. I'll take a smaller, well-qualified pipeline over a massive, bloated one any day of the week.
Salesmotion is an AI-powered account intelligence platform that helps B2B revenue teams turn real-world signals into measurable pipeline growth. Learn more about what we do.
Frequently Asked Questions
What is a good pipeline coverage ratio for B2B sales?
The industry gold standard is a 3:1 to 4:1 pipeline coverage ratio, meaning you should have three to four dollars in qualified pipeline for every dollar of quota. However, the right number depends on your historical win rate. A team closing at 50% can succeed with 2x coverage, while a team with a 20% win rate needs 5x or higher. Tailor your target to your actual performance data rather than chasing generic benchmarks.
How do you calculate pipeline coverage?
The basic formula is simple: divide the total value of your qualified sales pipeline by your sales target. For example, if your pipeline is worth $1,000,000 and your quota is $250,000, your coverage ratio is 4x. For greater accuracy, use an adjusted pipeline coverage ratio that weights each deal's value by its stage probability, giving a more realistic forecast.
What is the difference between pipeline coverage and pipeline health?
Pipeline coverage is the quantity of deals in your pipeline relative to your quota, while pipeline health measures the quality and momentum of those deals. A high coverage ratio with stagnant, low-quality opportunities creates a dangerous false sense of security. True pipeline health requires both sufficient volume and strong indicators like deal velocity, consistent win rates, and balanced deal sizes.
What is pipeline bloat and how do you fix it?
Pipeline bloat occurs when your pipeline is clogged with stagnant, low-quality "ghost deals" that show little buyer engagement but artificially inflate your coverage ratio. Symptoms include deals sitting in the same stage for months and close dates being repeatedly pushed out. Fix it by conducting regular pipeline audits, enforcing strict qualification criteria, and creating a culture where reps are encouraged to disqualify dead deals rather than hoard them.
How often should I review my sales pipeline?
Weekly pipeline reviews are the recommended cadence. Regular reviews help you spot deals that are starting to stall, identify coaching opportunities for reps, and keep your forecast grounded in reality. Waiting until the end of the month or quarter for pipeline reviews allows ghost deals to accumulate and gives you a false sense of security that leads to missed targets.
How does signal-based prospecting improve pipeline health?
Signal-based prospecting targets accounts showing real buying signals like funding rounds, executive hires, or competitive dissatisfaction, which generates higher-quality opportunities than generic outbound volume. These signals provide the "why now" context that creates urgency and moves deals faster through the pipeline, improving both deal velocity and win rates while reducing the risk of pipeline anemia from inconsistent prospecting.