
TL;DR: Pipeline velocity is the speedometer for your sales engine, telling you how fast you're generating revenue. By understanding and improving its four key drivers—opportunities, deal size, win rate, and sales cycle length—you can pinpoint bottlenecks, accelerate growth, and build a more predictable revenue stream.
Think of pipeline velocity as the speedometer for your sales engine. It’s a single metric that tells you how fast you’re actually generating revenue. Get a handle on it, and you can pinpoint exactly where your sales process is slow, stuck, or just plain broken. It's the key to accelerating growth and building a revenue stream you can actually predict.

Your Guide to Pipeline Velocity
So what is pipeline velocity, really? It’s a powerful metric that shows how quickly deals are moving through your sales pipeline and turning into actual, spendable revenue.
It's not just one thing, though. It’s a combination of four crucial factors:
- The number of opportunities you have in your pipeline.
- The average size of your deals.
- Your team's win rate (what percentage of deals you actually close).
- The length of your sales cycle (how long it takes to close a deal).
A high velocity is a great sign—it means you have a healthy, efficient sales process humming along. On the flip side, a low velocity can be a red flag, signaling bottlenecks or weaknesses that need your immediate attention. By tracking it, you can stop guessing and start knowing, making smarter decisions that have a direct impact on your bottom line.
Common Questions About Pipeline Velocity
What is a simple analogy for pipeline velocity?
Imagine your sales pipeline is a literal pipe with water flowing through it.
- Number of opportunities is the pipe's width.
- Deal size is the water pressure.
- Win rate is how much water makes it through without leaks.
- Sales cycle length is the speed of the flow.
Higher velocity means more water (revenue) gets through the pipe, faster.
Why is pipeline velocity a critical metric?
Because it's one of the few metrics that gives you a holistic, 360-degree view of your sales health. Instead of just looking at win rates or deal size in isolation, velocity weaves them all together. It shows you how effectively your entire sales machine generates revenue over time.
How often should I measure pipeline velocity?
For most businesses, tracking pipeline velocity on a monthly or quarterly basis hits the sweet spot. This gives you enough data to spot meaningful trends and lets your team implement changes and measure their impact. It keeps you from overreacting to small, week-to-week blips.
See Salesmotion in action
Take a self-guided interactive tour — no signup required.
What Is Pipeline Velocity and Why It Matters
Think of your sales process like a factory assembly line. Its job isn't just to crank out a finished product—a closed deal—but to do it efficiently and predictably. Pipeline velocity is the metric that tells you just how fast and healthy that assembly line is running.
It’s way more than a buzzword; it's the speedometer for your sales engine. It measures the speed at which deals move through your pipeline and actually turn into revenue. A high velocity means you're bringing in more money in less time. A low velocity is a clear signal that something, somewhere, is gumming up the works.
Unlike other metrics that only look at one piece of the puzzle, pipeline velocity gives you the full picture. It combines four key elements of your sales performance into a single, powerful number that reveals the true health of your revenue engine. This makes it an indispensable diagnostic tool for any sales team.
Why Is Pipeline Velocity So Important?
Tracking pipeline velocity is critical because it pulls you out of the world of guesswork and into data-driven decision-making. It tells you whether your reps' strategies are actually working and, more importantly, shines a spotlight on the specific friction points that are stalling your deals.
Knowing this number gives you actionable insights. You can see precisely where the bottlenecks are forming, which lets you make smart, strategic adjustments. For example, you might discover that a slowdown isn't from a lack of leads but from a negotiation stage that drags on forever.
Pipeline velocity is a leading indicator of future revenue. While trailing indicators like quarterly sales tell you what happened in the past, velocity helps you forecast what’s likely to happen next, giving you the power to proactively manage your sales outcomes.
This allows sales leaders to set more realistic expectations and build accurate revenue forecasts. When you truly understand how quickly your team can convert opportunities into cash, you can allocate resources more effectively and build a predictable growth model that you can actually count on.
Revealing Your Process Bottlenecks
One of the biggest benefits of measuring pipeline velocity is its uncanny ability to expose hidden problems. A pipeline that looks healthy on the surface—stuffed with plenty of opportunities—can easily hide underlying issues that a simple deal count would never catch.
For instance, consider these scenarios:
- Low Win Rates: Your team might be great at filling the top of the funnel, but if deals consistently fall apart at the end, your velocity will tank. This could point to a problem with lead qualification or weak sales messaging.
- Long Sales Cycles: Are deals getting stuck in one particular stage for weeks or even months? Velocity will pinpoint this immediately, prompting you to dig into why. For a deeper dive on optimizing your deal flow, learn more about structuring effective sales pipeline stages.
- Small Deal Sizes: If your reps are closing deals left and right but the average deal size is shrinking, your overall revenue growth will slow to a crawl. Velocity captures this trend instantly.
By breaking down the components of pipeline velocity, you can isolate the exact lever you need to pull. This focused approach is far more effective than just shouting "sell more!" without understanding the root cause of the problem. It transforms how you manage your team, shifting the focus from just activity to efficient, revenue-generating outcomes.

“Salesmotion has been a game-changer for me. I used to spend 12 hours a week on prospect research, now it's down to 4. Plus I'm finding stuff I was totally missing - podcasts, news mentions, the good bits.”
George Treschi
Account Executive, FY25 President's Club, Sigma
Understanding the Four Levers of Pipeline Velocity
To really get a handle on pipeline velocity, you have to break it down into its core components. Think of it like a car engine. Pushing the gas pedal isn't the only way to go faster; you also need the right fuel mix, efficient combustion, and minimal friction. Pipeline velocity works the same way—it's controlled by four distinct "levers" you can pull to accelerate revenue.
Each lever represents a critical part of your sales process. Understanding how they work together is the first step toward making strategic adjustments that actually move the needle. When you know which lever to pull and when, you gain precise control over your entire revenue engine.
This infographic breaks down how pipeline velocity connects the concepts of revenue, speed, and overall sales health.
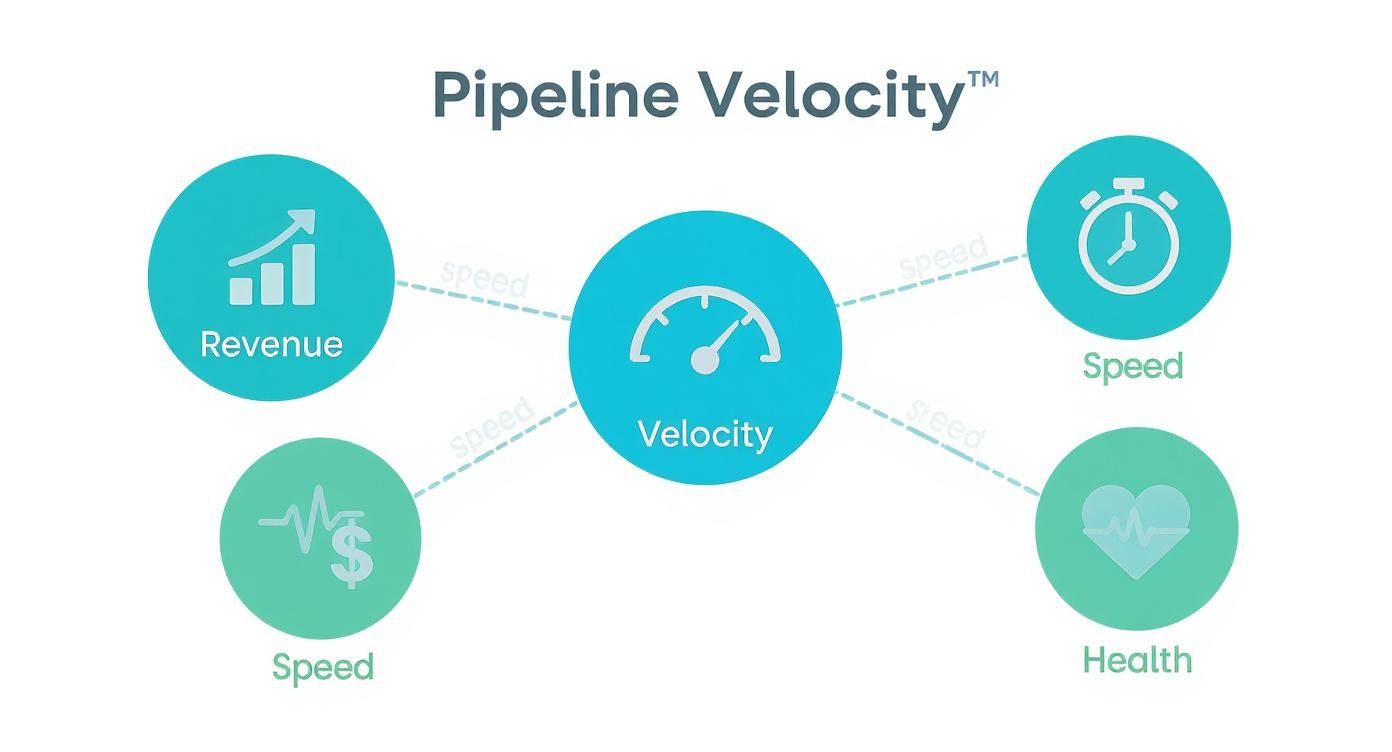 Pipeline velocity is the interplay between deal value, win rate, cycle speed, and overall pipeline health.
As you can see, velocity isn't just one thing. It's the dynamic interplay between how much money is in play, how fast it's moving, and the underlying health of your sales process.
The Core Formula
The whole concept of pipeline velocity boils down to a single, powerful formula. This calculation is a vital metric for understanding how effectively your team converts leads into customers because it balances quantity, quality, and speed all at once.
Pipeline Velocity = (Number of Opportunities × Average Deal Size × Win Rate) ÷ Length of Sales Cycle
This formula gives you a dollar amount per day (or month, or quarter), showing the value moving through your pipeline over that period.
Pipeline Velocity Formula Breakdown
To make this concrete, here is a step-by-step calculation using realistic numbers for a mid-market B2B team:
| Component | Your Value |
|---|---|
| Number of Qualified Opportunities | 120 |
| Average Deal Size | $18,000 |
| Win Rate | 22% (0.22) |
| Average Sales Cycle Length | 45 days |
Step 1 — Multiply opportunities by deal size to get your total pipeline value:
120 × $18,000 = $2,160,000
Step 2 — Apply your win rate to find expected revenue:
$2,160,000 × 0.22 = $475,200
Step 3 — Divide by sales cycle length to get your daily velocity:
$475,200 ÷ 45 = $10,560 per day
How to interpret this: A velocity of $10,560/day means your pipeline generates $10,560 in revenue potential every day. Over a 90-day quarter, that translates to roughly $950,400 in expected closed revenue. If that number falls short of your quota, you now know exactly which lever to pull — generate more qualified opportunities, increase deal sizes, improve your win rate, or shorten the cycle.
Use this same calculation each month or quarter against your own numbers to spot trends early. A declining velocity is a leading indicator that something in your process needs attention before it shows up as a missed target.
Now let's break down each of these four levers in detail.
Lever 1: Number of Qualified Opportunities
This is the "how many" part of the equation and the most straightforward lever. It’s the total number of qualified leads in your sales pipeline during a specific timeframe. More opportunities mean a wider pipeline, which naturally creates more potential for revenue.
But the key word here is qualified. Filling your pipeline with junk leads that will never close is a surefire way to waste time and resources. A healthy pipeline isn't just full; it’s full of opportunities that have a realistic shot at becoming customers.
- How to Influence It: This lever is mostly controlled by your marketing and top-of-funnel sales efforts. Strong lead generation, effective prospecting, and a crystal-clear Ideal Customer Profile (ICP) are essential for boosting this number with high-quality prospects.
Lever 2: Average Deal Size
Next up is the "how much" lever. This metric tracks the average revenue value of each closed-won deal. It’s a direct measure of the quality and value of the opportunities your team is pursuing.
Increasing your average deal size is one of the most efficient ways to boost pipeline velocity. You can close the same number of deals but generate significantly more revenue if each one is worth more. Think of it as increasing the water pressure in your pipeline—the same flow delivers more volume.
This often involves strategic tweaks to pricing, packaging, and sales tactics. For a deeper look into how these elements work together, you can check out our guide on RevOps best practices.
Lever 3: Win Rate
This is your team's batting average—the "what percentage" lever. Your win rate (or conversion rate) is the percentage of qualified opportunities that your team successfully closes. It's a direct reflection of your sales team's effectiveness and the strength of your entire sales process.
A high win rate shows your team is skilled at demonstrating value, handling objections, and guiding prospects to a decision. Even a small improvement here, say from 20% to 25%, can have a massive impact on your overall velocity because it compounds the value of every single opportunity in your pipeline.
- How to Influence It: Improving your win rate comes down to sales enablement, coaching, and process refinement. Better discovery calls, compelling demos, competitive positioning, and sharper negotiation skills all contribute directly to this metric.
Lever 4: Length of Your Sales Cycle
Finally, we have the "how fast" lever. This measures the average time it takes for an opportunity to move from initial contact to a closed deal, usually in days. A shorter sales cycle means you're converting opportunities into revenue more quickly.
Cutting down your sales cycle length is like reducing friction in your pipeline. The faster you can close deals, the faster you can move on to the next one, allowing your team to work through more opportunities in the same amount of time.
This involves hunting down and eliminating bottlenecks. Where do deals get stuck? Is it during legal review, pricing negotiations, or security assessments? Streamlining these stages can dramatically shorten your cycle and accelerate your pipeline velocity.
How to Calculate Your Pipeline Velocity
Alright, you've got the four levers that drive your revenue engine down. Now it's time to get our hands dirty and put the formula to work. Calculating your pipeline velocity is where abstract metrics become a real, tangible number—one that shows you exactly how much revenue your sales process is generating every single day.
To make this crystal clear, we'll walk through two very different business scenarios. This will show you how the variables play off each other depending on the sales model and what the final velocity number actually means for each company.
Scenario A: High-Volume SaaS Company
First up, let’s look at "SaaS Co." They sell a software subscription with a fairly short, transactional sales cycle. Their whole model is built around generating a ton of leads and converting them fast.
Here are their key metrics from the last quarter (90 days):
- Number of Qualified Opportunities: They had 200 solid opportunities in their pipeline.
- Average Deal Size: The average annual contract value (ACV) for a new customer is $5,000.
- Win Rate: Their sales team closes 25% of all qualified opportunities.
- Sales Cycle Length: On average, it takes them 30 days from first contact to a signed deal.
Now, let's plug those numbers into the pipeline velocity formula:
(200 Opportunities × $5,000 Deal Size × 25% Win Rate) / 30 Days
Here’s the breakdown:
- Total Pipeline Value: 200 opportunities × $5,000 = $1,000,000
- Expected Revenue: $1,000,000 × 0.25 (25%) = $250,000
- Pipeline Velocity: $250,000 / 30 days = $8,333 per day
The math shows that SaaS Co. is effectively generating $8,333 in new revenue every single day. This number is their baseline. Any strategic changes they make—tweaking their pricing, improving their sales script—can now be measured against this daily velocity to see if they’re actually speeding up the engine.
Scenario B: High-Value Enterprise Solution
Next, let's analyze "Enterprise Solutions Inc." This company sells complex, big-ticket solutions to large corporations. Their sales process is much longer and involves a ton of stakeholders, but each deal is a monster.
Here are their numbers over the last year (365 days):
- Number of Qualified Opportunities: They worked on 50 major opportunities.
- Average Deal Size: Each deal has an average contract value of $250,000.
- Win Rate: Because of the complexity, their win rate is lower at 15%.
- Sales Cycle Length: The average sales cycle is a marathon, clocking in at 180 days.
Let’s apply the formula to their business:
(50 Opportunities × $250,000 Deal Size × 15% Win Rate) / 180 Days
And the calculation:
- Total Pipeline Value: 50 opportunities × $250,000 = $12,500,000
- Expected Revenue: $12,500,000 × 0.15 (15%) = $1,875,000
- Pipeline Velocity: $1,875,000 / 180 days = $10,416 per day
Even with fewer opportunities, a lower win rate, and a sales cycle that's six times longer, Enterprise Solutions Inc. has a higher pipeline velocity ($10,416 per day) than SaaS Co. This is the perfect illustration that a smaller number of high-value deals can absolutely generate more daily revenue than a high volume of smaller transactions.
To bring this to life, here’s a quick table comparing the two scenarios side-by-side.
Pipeline Velocity Calculation Scenarios
| Metric | Scenario A (SaaS Co.) | Scenario B (Enterprise Solution) |
|---|---|---|
| Opportunities | 200 | 50 |
| Average Deal Size | $5,000 | $250,000 |
| Win Rate | 25% | 15% |
| Sales Cycle Length | 30 Days | 180 Days |
| Pipeline Velocity | $8,333 / day | $10,416 / day |
This comparison shows there's no single "right" way to build a powerful revenue engine. While one company focuses on quantity and speed, the other prioritizes deal size—and both can be successful.
Common Mistakes to Avoid When Calculating
Accuracy is everything. A flawed calculation leads to flawed decisions. As you figure out your own pipeline velocity, watch out for these common traps:
- Using Unqualified Leads: Only include opportunities that have met your specific sales qualification criteria. Shoving every raw lead into the formula will inflate your opportunity count and give you a misleadingly low win rate. Monitoring the right lead generation key performance indicators is essential to make sure only quality opps get counted.
- Inconsistent Time Frames: Make sure all four metrics are measured over the exact same period (like a specific quarter or year). Mixing monthly opportunities with an annual win rate will completely torpedo your results.
- Ignoring Outliers: A single, massive deal can seriously distort your average deal size. It’s a good idea to calculate velocity both with and without those huge outliers to get a more realistic picture of your typical performance.

“The Business Development team gets 80 to 90 percent of what they need in 15 minutes. That is a complete shift in how our reps work.”
Andrew Giordano
VP of Global Commercial Operations, Analytic Partners
Key Takeaways
- Pipeline velocity measures how quickly revenue moves through your sales funnel by combining four levers: number of qualified opportunities, average deal size, win rate, and sales cycle length.
- Even small improvements to a single lever create a compounding effect. A 10% boost in win rate combined with a 15% shorter cycle can dramatically increase the revenue flowing through your pipeline.
- Accurate calculation requires consistent data: use only qualified opportunities, measure all four metrics over the same time period, and watch for outlier deals that can distort your averages.
- The most actionable strategies focus on improving lead quality to boost opportunity count, shifting to value-based selling to grow deal size, investing in sales enablement to raise win rates, and automating processes to shorten the cycle.
- Track pipeline velocity regularly as a leading indicator of revenue health. Declining velocity signals problems before they hit your quota, giving you time to course-correct.
Actionable Strategies to Increase Pipeline Velocity
Knowing your pipeline velocity is step one. Actually improving it? That’s where the real growth kicks in. Once you have that baseline number, you can start strategically pulling the four levers we've talked about to get your revenue engine humming.
The goal isn't just to make a number go up for the sake of it. It's about making targeted improvements that build a faster, more efficient, and far more predictable sales process. This section is your playbook for making that happen.
Boost Your Number of Qualified Opportunities
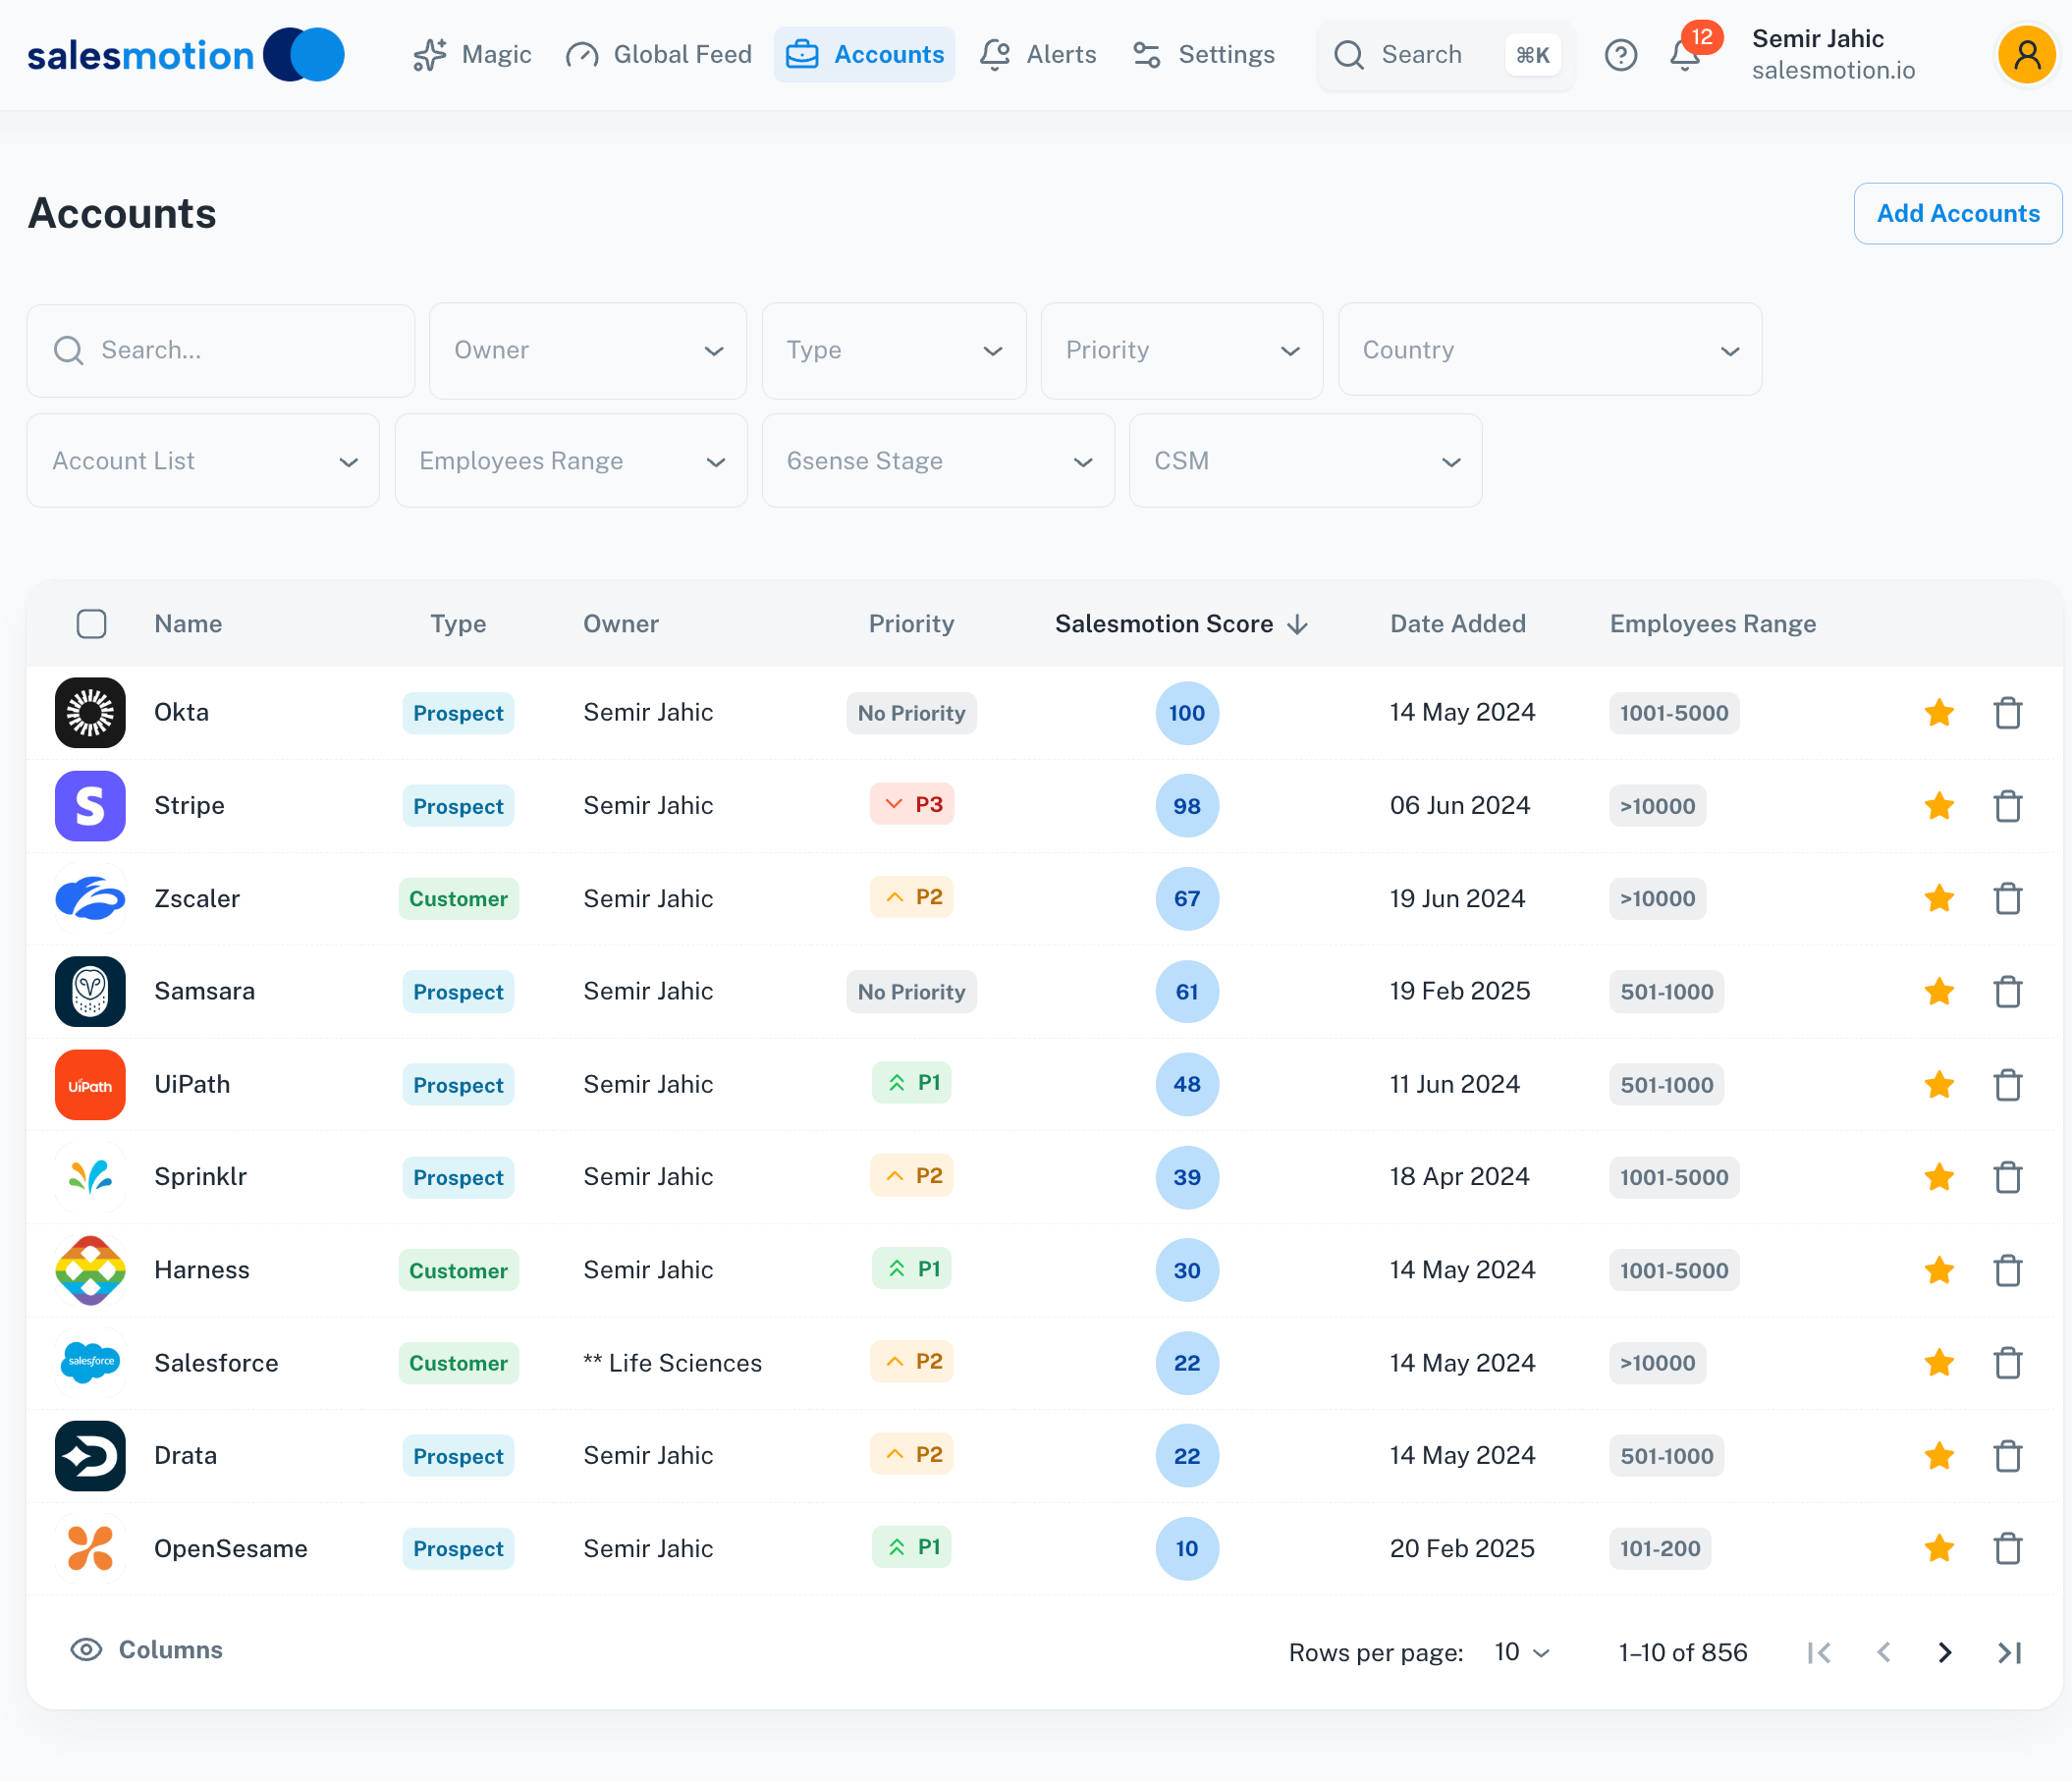 A scored dashboard prioritizes accounts by buying readiness, ensuring reps fill their pipeline with qualified opportunities rather than accounts that look good on paper but have no active buying signals.
Think of this as the fuel for your entire sales engine. Pumping up the volume of opportunities is a direct path to better pipeline velocity, but there's a catch: it only works if those opportunities are genuinely qualified. Flooding your pipeline with poor-fit leads will just slow everything down.
The focus here is on quality at scale. Here’s how to get there:
- Refine Your Ideal Customer Profile (ICP): Get razor-sharp on who your best customers really are. Dive into your most successful deals and pull out the common threads—industry, company size, specific pain points. A crystal-clear ICP ensures your marketing and sales teams are aiming at the same high-value targets.
- Align Sales and Marketing: This one is non-negotiable. When marketing is generating leads that sales actually wants, your opportunity count skyrockets. Get them in the same room regularly to hash out the definitions of a marketing-qualified lead (MQL) and a sales-qualified lead (SQL) for a seamless handoff.
- Implement a Strong Lead Qualification Framework: A well-defined lead qualification process is a game-changer for accelerating your pipeline. Frameworks like BANT (Budget, Authority, Need, Timeline) or MEDDICC are designed to make sure reps spend their valuable time on deals that have a real shot at closing.
Increase Your Average Deal Size
Closing bigger deals is one of the most efficient ways to boost velocity, period. You can keep the same win rate and sales cycle, but bring in significantly more revenue. This lever is all about wringing more value out of every single customer interaction.
Here are a few proven tactics:
- Master Upselling and Cross-selling: Train your reps to spot opportunities to sell premium tiers or complementary products. This is often easiest with existing customers, but it can also be woven into new business talks by digging deep into a prospect’s broader challenges.
- Introduce Tiered Pricing or Bundles: Structure your pricing to gently nudge customers toward larger purchases. Offering a "better deal" for a more complete package can guide them toward higher-value options, naturally lifting your average deal size.
- Focus on Value-Based Selling: Shift the conversation from price to ROI. When your reps can clearly articulate and quantify the financial impact of your solution, they can justify a higher price and win bigger contracts.
Improve Your Team's Win Rate
Your win rate is a direct reflection of your sales team's effectiveness. Even a small bump here creates a massive ripple effect across your entire pipeline. A higher win rate means you're squeezing more revenue from the same number of opportunities, making your whole process more efficient.
To nail this crucial metric, zero in on coaching and process refinement:
- Conduct Regular Deal Reviews: Actually sit down with your reps and dissect active deals. Coach them on strategy, sniff out potential risks, and brainstorm ways to crush objections before they can derail a sale.
- Invest in Sales Enablement: Arm your team with the right content, tools, and training. We’re talking compelling case studies, battle cards against top competitors, and a polished demo that speaks directly to customer pain points.
- Analyze Your Losses: Don't just pop the champagne for the wins; perform an autopsy on the losses. Create a formal process for logging the "why" behind every lost deal. Over time, you’ll uncover patterns—like a recurring feature gap or a competitor's sneaky pricing—that you can start to fix systematically.
Shorten Your Sales Cycle Length
The final lever is all about speed. The faster you can move a deal from "hello" to "closed-won," the more deals your team can juggle in a given period. Shortening your sales cycle comes down to one thing: finding and obliterating friction in the buying process.
Look for the stages where deals always seem to get stuck. Is it the legal review? The security sign-off? That final approval from the CFO? Once you find the bottlenecks, you can take action. Teams that adopt a signal-based selling approach often see cycle times drop because reps engage prospects at exactly the right moment — when buying intent is highest — rather than pushing deals that aren't ready to move.
One of the most powerful ways to remove friction is through automation. By automating all the repetitive, administrative junk, you free up your reps to do what they do best: sell. To see how you can put this into practice, check out our guide on sales process automation.
Other key strategies include:
- Create Clear Next Steps: Make sure every single customer interaction ends with a clear, mutually agreed-upon next step. This is how you stop deals from drifting aimlessly in the pipeline.
- Provide Upfront Pricing and Information: Ambiguity is the enemy of speed. Be as transparent as you can about pricing, implementation, and other key details to help buyers make decisions faster.
- Use Mutual Action Plans (MAPs): For complex deals, create a shared document that outlines the key milestones, who is responsible for what, and the timeline for both you and the buyer. This creates accountability and keeps the deal moving with real momentum.
Stop wasting hours on manual account research and start focusing on what matters—selling. Salesmotion is an AI-powered platform that delivers real-time account intelligence, automated executive briefs, and strategic points of view directly to your team. Empower your reps to have more meaningful, "why now" conversations and convert account signals into measurable pipeline growth. Learn how Salesmotion can accelerate your revenue engine.
Frequently Asked Questions
What is the pipeline velocity formula?
Pipeline velocity is calculated as: (Number of Qualified Opportunities multiplied by Average Deal Size multiplied by Win Rate) divided by Length of Sales Cycle. The result gives you a dollar amount per day showing how much revenue is effectively flowing through your pipeline over a given period.
How often should I measure pipeline velocity?
For most sales teams, tracking pipeline velocity on a monthly or quarterly basis is ideal. This frequency is long enough to smooth out week-to-week noise and reveal meaningful trends, yet short enough to let your team implement changes and measure their impact before small issues become major revenue problems.
What is a good pipeline velocity number?
There is no universal benchmark because it depends entirely on your business model. A high-volume SaaS company might see $5,000 per day, while an enterprise software firm could operate at $50,000 per day. Focus on establishing your own baseline and then working to consistently improve it rather than comparing to other companies.
Can I improve pipeline velocity without increasing my marketing budget?
Yes. Generating more opportunities is just one of four levers. You can also improve win rates through better sales coaching and qualification, increase average deal size by focusing on value-based selling and upselling, and shorten the sales cycle by removing bottlenecks in contract approval, legal review, or other internal processes.
Which of the four pipeline velocity levers has the biggest impact?
No single lever is universally most impactful because the answer depends on where your biggest bottleneck is. However, even small improvements compound across levers. A 10% boost in win rate combined with a 15% shorter sales cycle can dramatically increase revenue throughput without adding a single new opportunity to the pipeline.
What are common mistakes when calculating pipeline velocity?
The three most common errors are including unqualified leads in your opportunity count, mixing metrics from different time periods, and failing to account for outlier deals that distort your averages. Only include opportunities that meet your specific qualification criteria, ensure all four metrics cover the exact same period, and calculate velocity both with and without large outliers for a realistic picture.