Pipeline coverage ratio is the simplest metric in sales operations and one of the most frequently miscalculated. The basic concept is straightforward: divide your total qualified pipeline by your quota to determine whether you have enough at-bats to hit your number. If your win rate is 25% and your quota is $300K, you need $1.2M in pipeline (4x coverage). Simple math. Except that most teams calculate it wrong, benchmark it against the wrong standards, and make poor decisions based on a number that looks healthy but isn't.
TL;DR: Pipeline coverage ratio = qualified pipeline ÷ quota for the period. The standard benchmark (3x for enterprise, 4-5x for mid-market) is only useful if you're calculating it correctly. Most teams overstate coverage by including stale deals, using overall win rates instead of segment-specific rates, and measuring at the wrong point in the quarter. A "4x coverage" number that includes 30% dead deals is really 2.8x, which means you're not going to hit quota.
How to Calculate Pipeline Coverage Ratio
The formula is simple:
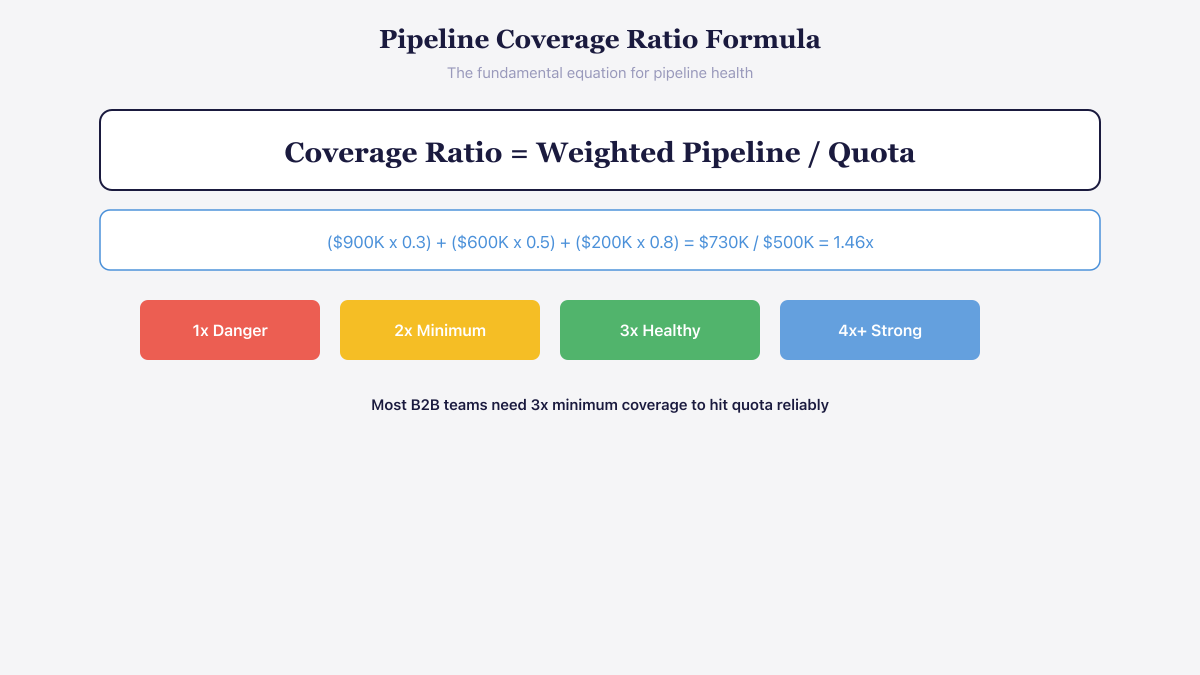 Most B2B teams need at least 3x weighted pipeline coverage to hit quota reliably.
Pipeline Coverage Ratio = Total Qualified Pipeline ÷ Quota (or Revenue Target)
Example: $1.5M qualified pipeline ÷ $400K quarterly quota = 3.75x coverage.
But "qualified pipeline" is where teams diverge. The three most common calculation errors:
Error 1: Including Stale Deals
A deal that hasn't progressed in 60 days is not contributing to this quarter's pipeline. If your $1.5M pipeline includes $400K in deals that haven't moved since last quarter, your real pipeline is $1.1M, and your real coverage ratio is 2.75x, not 3.75x.
Fix: Only count deals with verifiable activity in the last 30 days. Any deal without a logged meeting, email exchange, or stage progression in 30+ days should be flagged as stale and excluded from the coverage calculation (or moved to a separate "at risk" category).
Error 2: Using Overall Win Rate Instead of Segment-Specific Rates
Your overall win rate might be 25%, suggesting you need 4x coverage. But your enterprise deals might close at 20% (needing 5x) while your mid-market deals close at 35% (needing 3x). Using a blended rate either overestimates coverage for enterprise or underestimates it for mid-market.
Fix: Calculate coverage ratios by segment. An enterprise AE with $1M in qualified pipeline and a 20% win rate has expected revenue of $200K. A mid-market AE with the same $1M and a 35% win rate has expected revenue of $350K. Same pipeline, very different revenue expectations.
Error 3: Measuring at the Wrong Time
Coverage measured at the start of Q1 and coverage measured halfway through Q1 require different numbers. At the start of the quarter, you have 90 days for pipeline to progress. Halfway through, you only have 45 days. A deal in early stages at the start of the quarter has time to close. The same deal halfway through the quarter almost certainly won't.
Fix: Adjust coverage targets by time remaining. At the start of the quarter, 3-4x coverage of all-stage pipeline is healthy. Halfway through, focus on late-stage pipeline (proposal and negotiation stages) where the coverage should be 1.5-2x of remaining quota.
What's a Good Pipeline Coverage Ratio?
The short answer: it depends on your sales cycle length, win rate, and deal complexity.
| Sales Motion | Win Rate Range | Recommended Coverage | Why |
|---|---|---|---|
| Enterprise (6+ month cycles) | 15-25% | 3-5x | Fewer, larger deals with longer close times. Need multiple shots because each deal is high-risk. |
| Mid-market (2-4 month cycles) | 25-35% | 3-4x | Moderate deal flow. Standard benchmark applies. |
| SMB / velocity (< 2 month cycles) | 30-45% | 4-6x | Higher win rates but more deal flow volatility. Higher coverage absorbs quarterly variance. |
| New territory / new product | Any | 5-7x | Unproven conversion rates require a larger margin of safety until historical data is established. |
Why SMB needs higher coverage despite higher win rates: Short cycles mean deals enter and exit the pipeline quickly. A single lost deal in enterprise represents weeks of invested time. A single lost deal in SMB represents a day. But the volume of deals flowing through the pipeline creates statistical volatility that higher coverage absorbs.
See the product in action
Take a self-guided tour of the Salesmotion platform — no signup required.
Pipeline Coverage by Quarter Stage
Don't use the same coverage target all quarter. Adjust as time erodes the probability of early-stage deals closing within the period.
| Quarter Stage | What to Measure | Healthy Coverage |
|---|---|---|
| Week 1-3 | All-stage qualified pipeline vs. full quota | 3-4x (enterprise), 4-5x (mid-market) |
| Week 4-6 | Pipeline weighted by stage probability vs. remaining quota | 2-3x weighted coverage |
| Week 7-9 | Late-stage pipeline (proposal + negotiation) vs. remaining quota | 1.5-2x of remaining target |
| Week 10-12 | Commit deals (negotiation + verbal) vs. remaining quota | 1.1-1.3x (this IS your forecast) |
The most important shift: By mid-quarter, stop looking at total pipeline and start looking at weighted or late-stage pipeline. Early-stage deals created in week 7 of a quarter with a 90-day average sales cycle are not closing this quarter. Including them in coverage creates false confidence.
How to Fix a Coverage Gap
When coverage drops below target, there are only four levers:
1. Create More Pipeline (Increase Numerator)
Immediate actions:
- Activate Tier 2 accounts showing new buying signals (leadership changes, funding, hiring surges)
- Re-engage closed-lost opportunities from the past 6 months with new context
- Ask existing customers for referrals targeting specific accounts
- Increase outbound activity on Tier 1 accounts that haven't been contacted
Timeline: Pipeline creation takes 2-4 weeks to impact coverage. If you're past mid-quarter, creating new early-stage pipeline won't help this quarter's number.
2. Increase Win Rate (More Efficient Conversion)
Immediate actions:
- Conduct deal reviews on all mid-to-late stage opportunities to identify blockers
- Add executive engagement (sponsor calls, executive briefings) to stalled deals
- Strengthen competitive positioning on deals where competitors are active
- Ensure every deal has multi-threaded stakeholder engagement
Timeline: Win rate improvements take one full sales cycle to measure. Tactical improvements (executive engagement, competitive positioning) can impact specific deals within weeks.
3. Increase Deal Size (Larger Deals Cover More Quota)
Immediate actions:
- Review active proposals for expansion opportunities (additional users, modules, or services)
- Reframe solution scope based on the buyer's full problem, not just the initial request
- Introduce multi-year pricing that increases contract value
Timeline: Deal size adjustments can impact individual deals within the current quarter.
4. Accelerate Deals (Faster Close Means More Closes Per Period)
Immediate actions:
- Identify and address the specific blockers slowing each deal (missing stakeholder, unresolved objection, unclear decision process)
- Provide account intelligence that gives champions ammunition for internal advocacy
- Create urgency through time-limited value (ROI increases with earlier implementation, competitive risk of waiting)
Teams like Frontify achieved 42% sales velocity improvement by using Salesmotion's signal-driven intelligence to identify and unblock stalled deals, directly improving their pipeline coverage efficiency.

“We're no longer fishing. We know who the right customers are, and we can qualify them quickly. Salesmotion has had a direct impact on pipeline quality.”
Andrew Giordano
VP of Global Commercial Operations, Analytic Partners
The Coverage Quality Filter
A coverage ratio is only as good as the pipeline quality behind it. Apply these quality filters before trusting your number:
Filter 1: Deal freshness. What percentage of pipeline has had activity in the last 14 days? Healthy: 70%+. Below 50%: your coverage is inflated.
Filter 2: ICP fit. What percentage of pipeline deals match your ideal customer profile? Deals outside ICP close at significantly lower rates, artificially inflating coverage.
Filter 3: Multi-threading depth. What percentage of deals have 3+ stakeholder relationships? Single-threaded deals are 2-3x more likely to stall or lose, reducing effective coverage.
Filter 4: Stage-appropriate qualification. Are deals in each stage actually qualified to be there? If reps advance deals to "proposal" without validating economic buyer access or decision criteria, the stage probability is meaningless.
Key Takeaways
- Pipeline coverage ratio = qualified pipeline ÷ quota. The formula is simple, but calculating it correctly requires excluding stale deals, using segment-specific win rates, and adjusting by quarter stage.
- Standard benchmarks: 3-5x for enterprise, 3-4x for mid-market, 4-6x for SMB/velocity. New territories need 5-7x until conversion rates are established.
- Adjust coverage targets through the quarter. Full-pipeline coverage matters in weeks 1-3. By mid-quarter, focus on late-stage and weighted pipeline against remaining quota.
- When coverage is short, four levers apply: create more pipeline, increase win rate, increase deal size, or accelerate existing deals. The right lever depends on where you are in the quarter.
- Quality filters (deal freshness, ICP fit, multi-threading, stage qualification) determine whether your coverage number is real or inflated. A 4x ratio with 30% stale deals is really 2.8x.
- Coverage is a leading indicator, not a guarantee. Track it weekly and act on gaps immediately rather than discovering at month-end that coverage was insufficient.
Frequently Asked Questions
What is a pipeline coverage ratio?
Pipeline coverage ratio measures how much qualified pipeline you have relative to your sales quota or revenue target for a given period. The formula is: Total Qualified Pipeline ÷ Quota = Coverage Ratio. A 3x coverage ratio means you have three dollars of pipeline for every dollar of quota. The ratio helps determine whether your team has enough active opportunities to achieve their target, given historical conversion rates.
Why is my pipeline coverage ratio misleading?
The three most common reasons: stale deals inflating the number (deals without recent activity that won't close), using a blended win rate across segments with very different conversion rates, and measuring at the wrong point in the quarter (early-stage deals created mid-quarter won't close in time). Apply quality filters: exclude deals with no activity in 30+ days, calculate by segment, and adjust targets by quarter stage.
What pipeline coverage ratio do I need?
Divide 1 by your historical win rate. If your win rate is 25%, you need 4x coverage (1 ÷ 0.25 = 4). If your win rate is 33%, you need 3x. Add a buffer (0.5-1x) for deal slippage and unexpected losses. Enterprise motions typically need 3-5x, mid-market 3-4x, and SMB/velocity 4-6x. New products or territories should target 5-7x until conversion rates stabilize.
How often should pipeline coverage be measured?
Weekly. Pipeline coverage is a leading indicator that gives you time to act on gaps. Monthly measurement discovers problems too late for mid-quarter correction. At the start of each quarter, measure total pipeline coverage. By mid-quarter, shift to late-stage coverage (proposal and negotiation stages) against remaining quota. Track week-over-week trends to spot deterioration early.