Ask 10 sales leaders for their win rate, you'll get 10 different numbers — and probably 10 different formulas. That's the real problem with "industry benchmarks": most published averages mix apples and oranges, blending qualified-opportunity rates with raw lead-to-close rates and segment medians that don't apply to your business.
This guide cuts through the mess. By the end you'll know which formula to use for your motion, what to benchmark against for your segment and deal size, and the three measurement traps that quietly inflate most leaders' numbers by 10–15 points. Jump straight to the five calculation methods, segment benchmarks, or diagnosing a low win rate below.
The average B2B sales team wins roughly 21% of its deals. That number, from HubSpot's survey of over 1,000 sales reps, means nearly four out of five opportunities end in closed-lost. Yet when you ask most sales leaders what their win rate is, they'll quote a number between 30% and 50%. The gap isn't dishonesty — it's measurement inconsistency.
TL;DR: The average B2B win rate is 21% across all opportunities, rising to ~29% for qualified opportunities only. Enterprise deals above $100K ACV see median win rates of just 15%. The formula you use matters: excluding "no decision" outcomes inflates your number by 10-15 percentage points. A healthy win rate depends on your segment, deal size, and sales motion, not an arbitrary industry benchmark.
How to Calculate Sales Win Rate
There are five common methods, and each tells you something different. The right formula depends on what question you're trying to answer.
 Win rates decrease predictably with deal complexity — benchmark against your segment.
Method 1: Basic Win Rate (Most Common)
Win Rate = (Deals Won / (Deals Won + Deals Lost)) x 100
This is the standard formula most CRMs use. It only counts opportunities with a final outcome, excluding open or stalled deals. If you won 20 deals and lost 60, your win rate is 25%.
Best for: Measuring competitive effectiveness when deals reach a decision point.
Method 2: Win Rate Including All Opportunities
Win Rate = (Deals Won / Total Opportunities Created) x 100
This includes open, stalled, and "no decision" outcomes in the denominator. The same 20 wins against 150 total opportunities created gives you 13.3%, a much less flattering but more honest picture.
Best for: Understanding full pipeline efficiency and identifying where deals go to die.
Method 3: Revenue-Weighted Win Rate
Revenue Win Rate = (Dollar Value of Won Deals / Dollar Value of All Closed Deals) x 100
This gives more weight to larger deals. If you won $300K out of $650K in total closed deals, your revenue win rate is 46.1%, even if your deal-count win rate is lower.
Best for: Teams with high variance in deal sizes where a few large wins distort the count-based number.
Method 4: Win/Loss Ratio
Win/Loss Ratio = Number of Won Deals / Number of Lost Deals
Expressed as a ratio (e.g., 1.5:1) rather than a percentage. A ratio above 1.0 means you win more than you lose. Below 1.0 means the opposite.
Best for: Quick competitive health check. Easy to track month over month.
Method 5: Period-Based Win Rate
Period Win Rate = (Won Deals in Period / Total Closed Deals in Period) x 100
Used for trend analysis. Calculate monthly or quarterly to spot directional changes before they compound.
Best for: Identifying whether win rates are improving or degrading over time.
The "No Decision" Question
The single biggest variable in win rate calculation is whether "no decision" counts as a loss. Including stalled deals that never reached a verdict gives you a conservative, realistic number. Excluding them measures only competitive wins vs. losses but ignores the deals that died from inaction, which according to multiple studies represent 40-60% of enterprise pipeline.
Choose one method and stick with it. Switching formulas between quarters makes trend analysis meaningless.
What Does a "Good" Win Rate Look Like in 2026?
There is no universal good win rate. The benchmark depends on your segment, average deal size, and sales motion. Here's what the data shows.
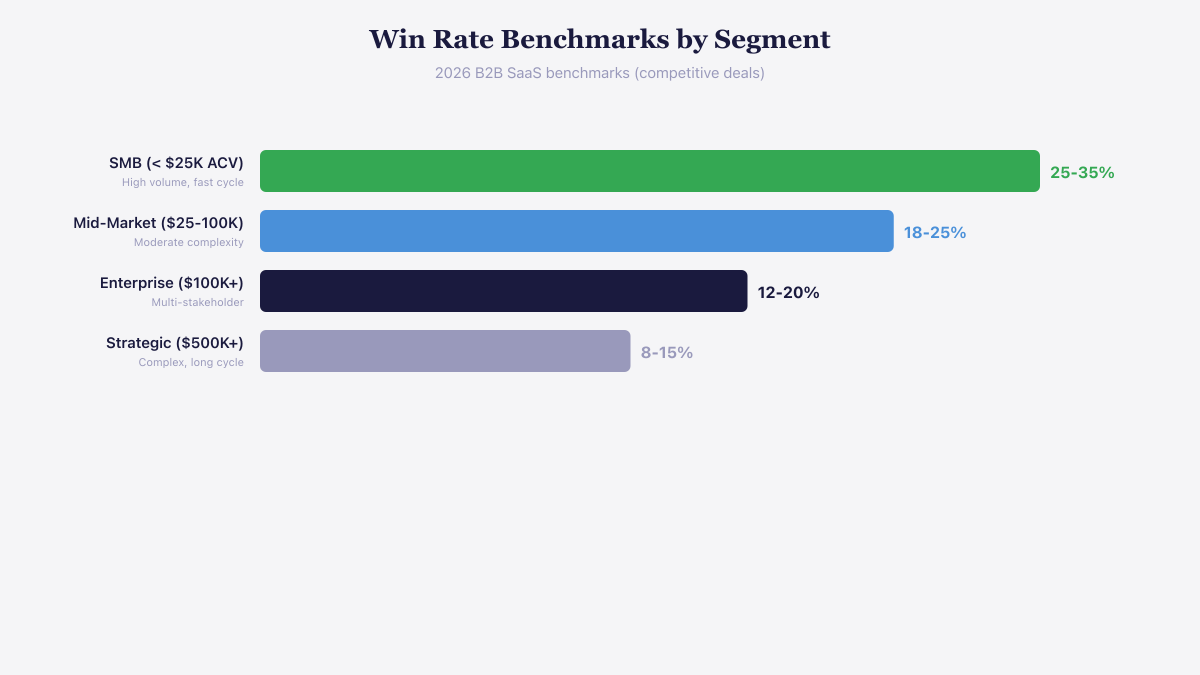
Win Rate by Deal Size (B2B SaaS)
An Optifai benchmark study of 847 B2B SaaS companies in 2025 found clear patterns:
| ACV Range | Segment | Median Win Rate |
|---|---|---|
| Under $10K | SMB | 31% |
| $10K-$50K | Mid-Market | 24% |
| $50K-$100K | Upper Mid-Market | 18% |
| Over $100K | Enterprise | 15% |
The pattern is consistent: as deal size increases, win rates decrease. Enterprise deals involve more stakeholders (an average of 13 decision-makers per deal in 2026), longer procurement cycles, and higher competitive intensity.
Win Rate by Sales Motion
| Motion | Win Rate Range |
|---|---|
| Warm/relationship-led | 30-40% |
| Inbound enterprise POC | 20-25% |
| Cold outbound enterprise | 10-18% |
| Selling to known contacts | 37% |
According to Champify's 2025 Impact Report, selling to known contacts (former customers, past champions who changed jobs) delivers a 37% win rate compared to 19% for cold outreach. That's nearly a 2x improvement from relationship leverage alone.
Win Rate by Industry
| Industry | Typical Win Rate | Avg Sales Cycle |
|---|---|---|
| SaaS and Technology | ~22% | 67 days |
| Financial Services | ~18% | 89 days |
| Professional Services | 25-30% | Shorter |
| Real Estate/Construction | ~16% | 147 days |
The Healthy Range
- Above 40%: Your team might be under-qualifying or only pursuing safe deals. High win rates can actually signal missed revenue if reps avoid stretch opportunities.
- 20-35%: The healthy zone for most B2B teams. A mix of high-probability deals and strategic bets.
- Below 15%: Likely signals lead quality problems, ICP misalignment, or fundamental gaps in the sales process.
See the product in action
Take a self-guided tour of the Salesmotion platform — no signup required.
Where Deals Actually Die: Stage-by-Stage Loss Analysis
Understanding your win rate is step one. Understanding where you lose is where the improvement happens.
Enterprise SaaS loss data shows a clear pattern:
| Sales Stage | % of Closed-Lost Deals | Top Loss Reason |
|---|---|---|
| Discovery | 35% | Poor discovery, status quo wins |
| Qualification | 28% | Budget constraints, no authority |
| Needs Assessment | 22% | Solution gaps, competitor fit |
| Proposal/Negotiation | 12% | Price objections, unproven ROI |
| Contract/Closing | 3% | Budget cuts, champion departure |
The critical insight: 63% of losses happen before needs assessment. That means better upfront qualification is the single highest-leverage improvement most teams can make. Improving discovery quality and tightening qualification frameworks has a larger impact on win rates than negotiation training or proposal optimization.
Five Factors That Actually Move Win Rates
Research from Ebsta, Gartner, and multiple B2B benchmarking studies points to five levers that consistently separate high-performing teams from average ones.
1. Speed to Engagement
Responding to inbound interest within 5 minutes correlates with 21% higher win rates. After 24 hours, rates drop roughly 60%. The data is unambiguous: speed wins.
2. Multi-Threading
Engaging three or more contacts per deal produces 2.4x higher close rates, rising to 3.1x for enterprise deals. With buying committees averaging 13 people, single-threaded deals are increasingly fragile. One champion departure or budget reassignment can kill a deal that had no backup relationships.
3. Qualification Rigor
Fully documented qualification criteria (using frameworks like MEDDIC or MEDDPICC) correlate with 40% higher close rates. The discipline isn't the framework itself. It's the forcing function that makes reps understand the buyer's decision process before committing pipeline.
4. Account Intelligence and Timing
Win rates improve significantly when reps engage accounts showing active buying signals: leadership changes, hiring patterns, earnings call language about transformation initiatives, or competitive vendor evaluations. Salesmotion monitors these signals across 1,000+ sources per account, surfacing which accounts are in active buying windows. Frontify's sales team saw a 35% win rate increase by focusing on signal-qualified opportunities rather than working cold pipeline.
5. Deal Velocity Management
Deals that exceed the average sales cycle length by more than 50% have a dramatically lower probability of closing. Tracking velocity by stage and intervening when deals stall, rather than letting them age in pipeline, preserves win rates and forecast accuracy.

“We're no longer fishing. We know who the right customers are, and we can qualify them quickly. Salesmotion has had a direct impact on pipeline quality.”
Andrew Giordano
VP of Global Commercial Operations, Analytic Partners
How to Improve Your Win Rate Without Inflating It
The temptation is to improve the number by tightening the definition: exclude more deals from the denominator, only count opportunities past stage 3, or reclassify losses as "not a real opportunity." This produces a better-looking metric that tells you nothing useful.
Instead, focus on these operational improvements:
Tighten qualification at the top. If 63% of losses happen in discovery and qualification, invest in better upfront account research. Reps who enter discovery calls knowing the account's strategic priorities, recent leadership changes, and likely pain points run fundamentally different conversations than those who start with "tell me about your business."
Multi-thread every deal above your average ACV. Create a process that requires identifying at least three stakeholders by the end of discovery. Track contact engagement breadth as a pipeline health metric alongside stage progression.
Track "no decision" separately from competitive losses. These are different problems. Competitive losses require better positioning and differentiation. No-decision losses require better qualification and urgency creation. Lumping them together masks the root cause.
Review stage-by-stage conversion rates quarterly. Win rate is a lagging indicator. Stage conversion rates are leading indicators that reveal problems before they show up in the quarterly number.
Benchmark against yourself, not industry averages. Your historical trend matters more than whether you're above or below the B2B average. A team that improved from 18% to 23% is in better shape than a team that's been flat at 30% for three years.
Key Takeaways
- The average B2B win rate is approximately 21% across all opportunities, but this varies significantly by deal size (31% for SMB, 15% for enterprise over $100K ACV).
- How you calculate win rate matters more than the number itself. The "no decision" inclusion question alone can swing your metric by 10-15 percentage points.
- 63% of deal losses happen before needs assessment, making upfront qualification the highest-leverage improvement for most teams.
- Multi-threading (3+ contacts per deal) produces 2.4x higher close rates and is increasingly essential as buying committees grow to 13+ stakeholders.
- Selling to known contacts delivers a 37% win rate versus 19% for cold outreach, making relationship intelligence one of the most efficient win rate levers available.
- Track win rate trends over time rather than benchmarking against industry averages. Your trajectory matters more than your absolute number.
Frequently Asked Questions
What is a good win rate for B2B sales?
A healthy B2B win rate typically falls between 20-35%, depending on deal size and sales motion. SMB teams often see 28-35%, mid-market teams 20-28%, and enterprise teams selling deals above $100K ACV average around 12-18%. Win rates above 40% may indicate under-qualification, while rates below 15% suggest fundamental pipeline quality issues.
Should "no decision" deals count as losses in win rate calculation?
It depends on what you're measuring. Including "no decision" outcomes gives a more conservative, realistic picture of pipeline efficiency. Excluding them measures only competitive effectiveness when buyers actually make a choice. Most RevOps teams recommend tracking both: a competitive win rate (won vs. lost) and a pipeline win rate (won vs. all outcomes) to get the full picture.
How do you improve win rate without just qualifying fewer deals?
Focus on the 63% of losses that happen before needs assessment. Improve discovery quality with AI account research, multi-thread deals by engaging 3+ stakeholders early, and track stage-by-stage conversion rates to identify where deals stall. Speed to engagement (responding within 5 minutes to inbound interest) also correlates with a 21% win rate improvement.
What is the difference between win rate and close rate?
Win rate measures won deals as a percentage of deals with a final outcome (won plus lost), indicating competitive effectiveness. Close rate measures won deals as a percentage of all opportunities including open ones, indicating overall pipeline efficiency and velocity. A team can have a strong win rate but weak close rate if too many deals stay open indefinitely without reaching a decision.