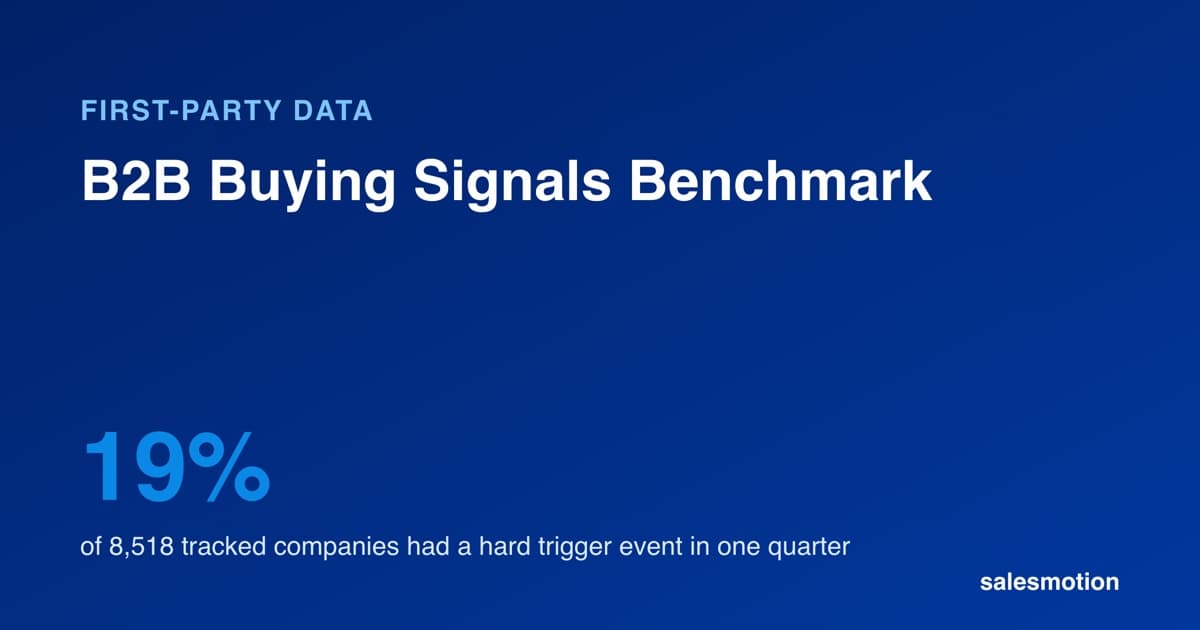
In one quarter, about one in five B2B companies a sales team tracks produces a hard trigger event, and most of the rest produce only context. Across 8,518 companies tracked in Salesmotion, 18.7% had at least one M&A, funding, partnership, expansion or product-launch signal between July and September 2026; counting relevant hiring as well, 30.8% did. 85% produced at least one buying signal of any kind, and the median company produced 7. Companies with more than 10,000 employees produced far more signals, and far more triggers, than small ones.
Key takeaways (Q3 2026, 8,518 companies, each counted once)
- 18.7% of tracked companies had a hard trigger event in the quarter (M&A, funding, partnership, expansion or product launch). 30.8% did when relevant hiring counts.
- 85% produced at least one buying signal of any kind; 15% produced none.
- 43% appeared in leadership and executive news, but only about a third of those stories were appointments or departures. Treat it as context to check.
- 100 tracked companies produced 933 relevant news signals, 314 podcast or video mentions, 117 press releases, 70 relevant job postings, 26 earnings calls and 20 SEC filings in one quarter.
- At companies with two or more trigger events, the median gap between them was 10.5 days.
- Size decides volume: 40% of companies with 10,001+ employees had a trigger event in the quarter, against 8% of companies with 200 or fewer.
Download the aggregate data (CSV)
What This Benchmark Measures
A buying signal is a public event at a target account that changes what the account needs or when it will buy. A sales trigger event is the subset of signals that usually opens a buying window. In this benchmark that means deals, money, partnerships, new markets and new products.
This benchmark counts the signals Salesmotion surfaced on companies that sales teams track in Salesmotion. It answers three planning questions with first-party data instead of guesses:
- How many buying signals should a rep expect from a book of accounts each quarter?
- Which trigger events are common, and which are rare?
- How does signal volume change with company size and industry?
Every number below comes from the same dataset. The method, definitions and exclusions are in the methodology section at the end.
See which of your accounts moved this quarter
Salesmotion's Signal Agent watches 1,000+ public sources across your accounts and tells you which ones gave you a reason to call.
Buying Signals per 100 Companies, by Type
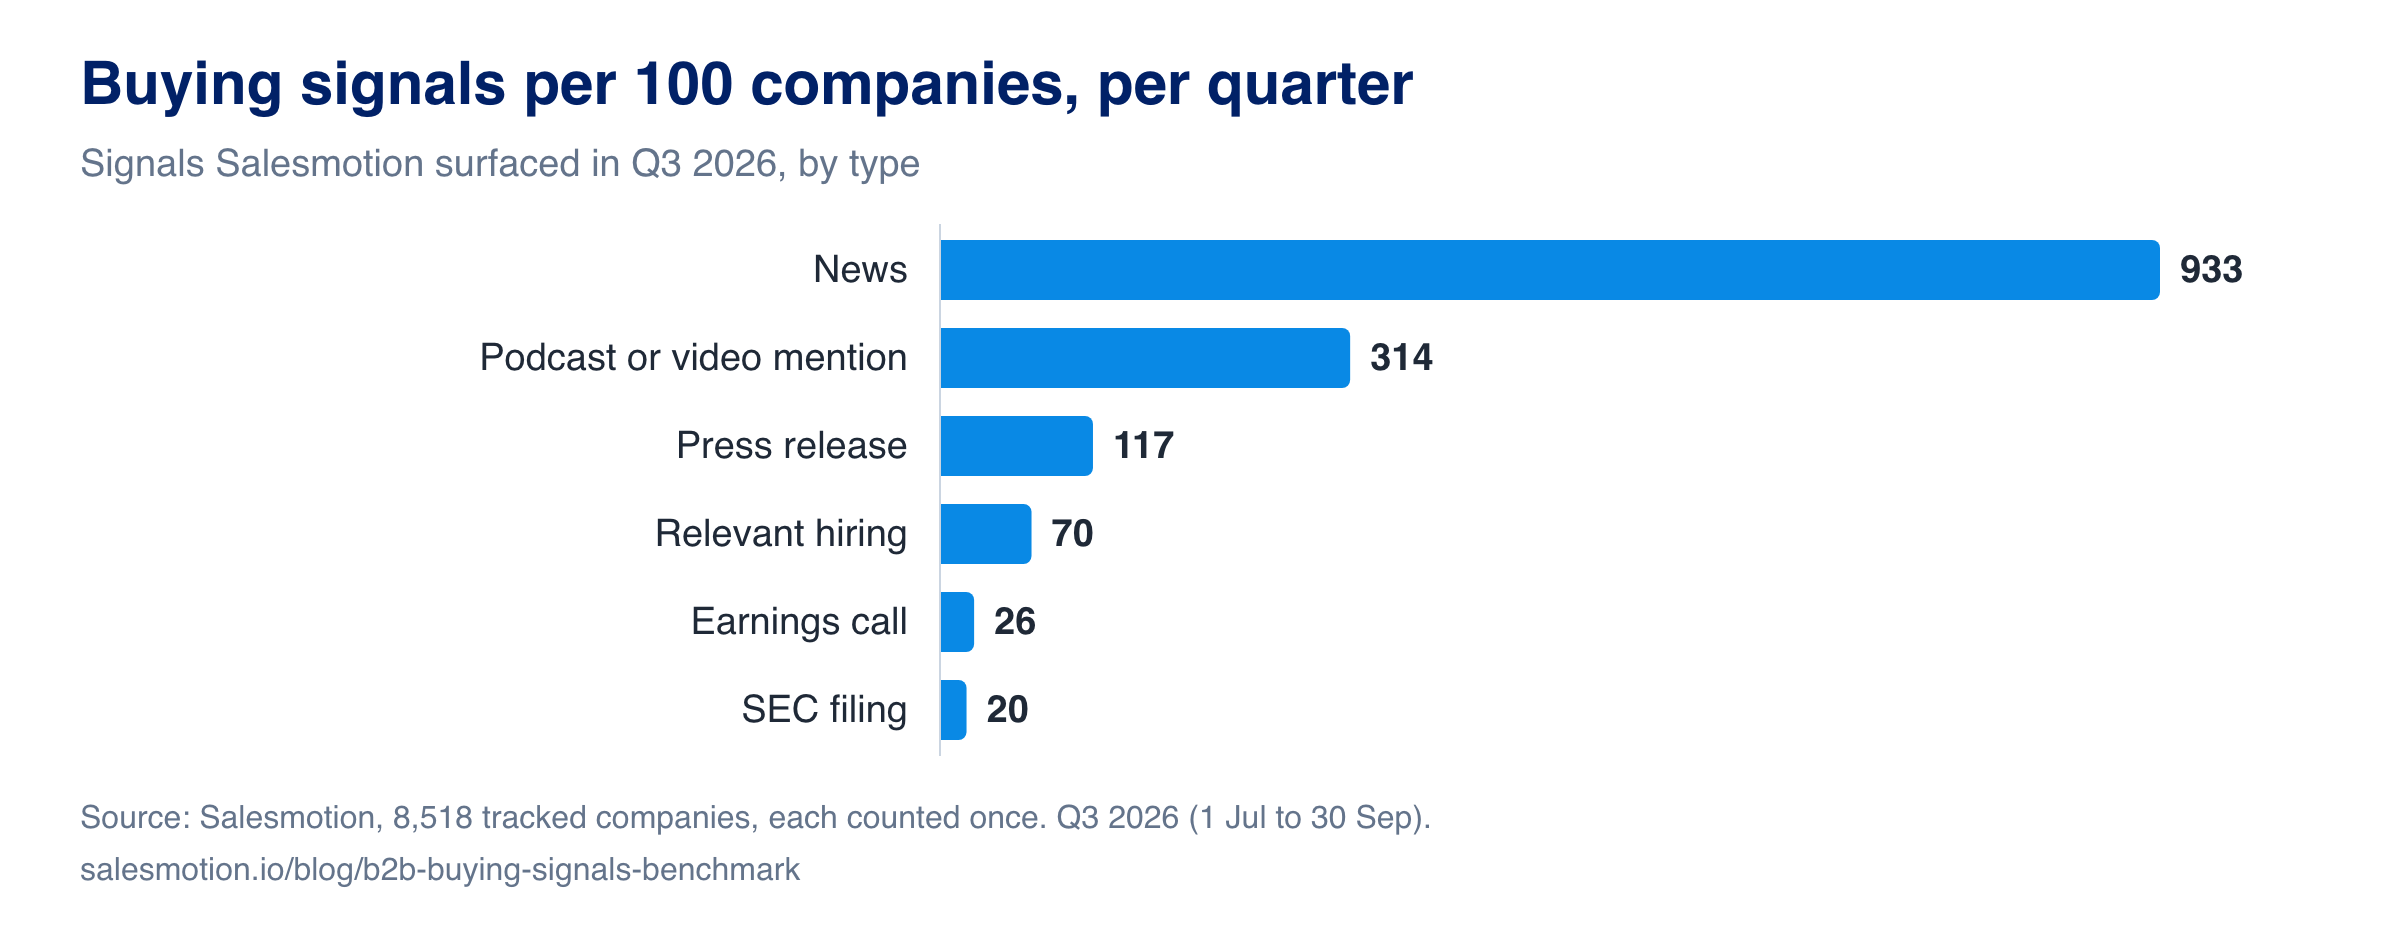
| Signal type | Signals per 100 companies, Q3 2026 | What it is |
|---|---|---|
| Relevant news | 933 | A news article about the company that Salesmotion judged relevant to the seller's offer |
| Podcast or video mention | 314 | The company or its leaders discussed on a podcast or video |
| Press release | 117 | A release the company issued itself |
| Relevant hiring | 70 | A new job posting for the roles the seller cares about |
| Earnings call | 26 | A quarterly results call (public companies) |
| SEC filing | 20 | A 10-Q, 10-K or proxy statement (US-listed companies) |
The life-sciences subset adds clinical trial updates: 218 per 100 companies across the 266 companies whose workspaces track trials. That group is small, so treat the figure as directional.
What this means for a 100-account book. A rep with 100 tracked accounts receives roughly 1,500 signals a quarter, or more than 100 a week. Most of them are context, not reasons to call. The rest of this page separates the two.
Sales Trigger Events: Which Ones Actually Happen
Every news signal carries one category. Five categories count as trigger events here, because each one tends to reopen budgets, priorities or vendor choices and the category label reliably describes the event. The rest is context: useful for a message, rarely a reason to send one.
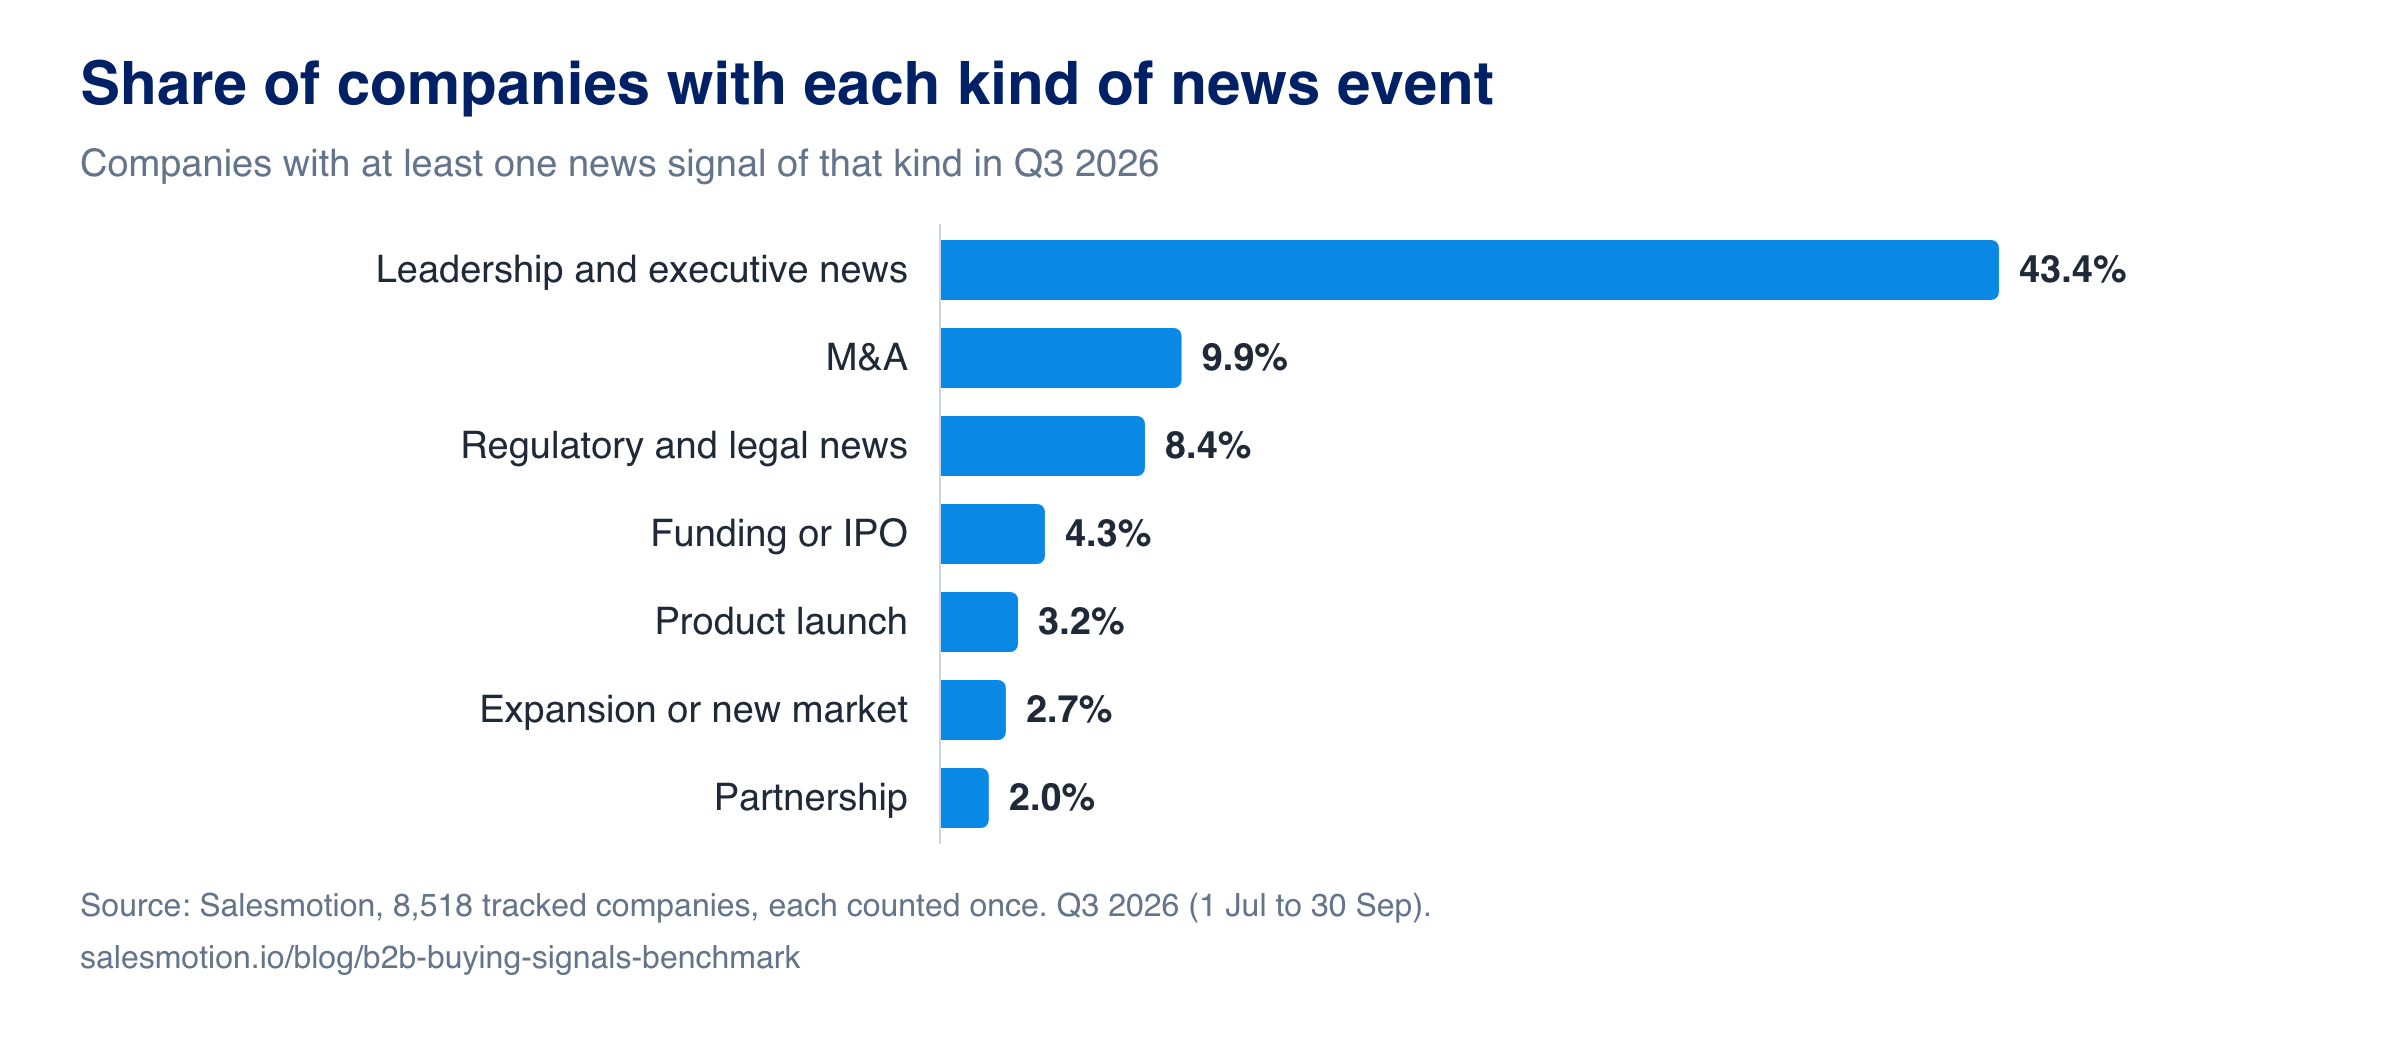
| News category, Q3 2026 | Share of companies with at least one | Signals per 100 companies | Counts as a trigger event |
|---|---|---|---|
| M&A (acquisition, merger, divestiture) | 9.9% | 32 | Yes |
| Funding round or IPO | 4.3% | 8 | Yes |
| Product launch | 3.2% | 7 | Yes |
| Expansion or new market | 2.7% | 5 | Yes |
| Partnership | 2.0% | 4 | Yes |
| Any trigger event | 18.7% | ||
| Financial results | 48.1% | 360 | Context |
| Leadership and executive news | 43.4% | 153 | Context |
| Strategy | 39.3% | 132 | Context |
| Technology or AI | 17.5% | 54 | Context |
| Regulatory and legal news | 8.4% | 19 | Context |
Four things stand out:
- M&A is the most common hard trigger. One in ten tracked companies had an acquisition, merger or divestiture story in the quarter. Integration work, duplicate tools and new budget owners follow.
- Funding is rarer than its reputation. 4.3% of tracked companies had a story labelled funding or IPO. A prospecting motion built only on funding alerts will run dry for most books of accounts.
- Leadership news is everywhere, leadership change is not. 43% of companies appeared in leadership and executive news, but in a hand check only about a third of those stories were appointments or departures; the rest were interviews, pay disclosures and executive commentary. Check each one before treating it as a new-leader play. The buying triggers guide covers what to do when it is real.
- Most news is context. Financial results, strategy and technology stories outnumber trigger events many times over. Use them for the first line of an email and for account plans.
Add relevant hiring to the trigger events and 30.8% of companies gave a seller a clear reason to call in the quarter. Hiring alone reached 17.4%.
How Often Buying Signals Arrive
| Measure (May to September 2026) | Median days between signals | Middle half of companies | Companies measured |
|---|---|---|---|
| Any signal | 5.5 | 3 to 13 days | 7,074 |
| Trigger event | 10.5 | 3 to 30 days | 1,280 |
| Leadership and executive news | 15 | 6 to 34 days | 3,295 |
Each company's median gap was measured first, then the median across companies. Only companies with at least two signals of that kind count.
The practical reading: at an account that produces trigger events, the next one often arrives within two weeks. A signal that waits a month in a rep's inbox has usually been overtaken by the next one. The signal-based selling guide sets response windows by signal type.
Buying Signals by Company Size
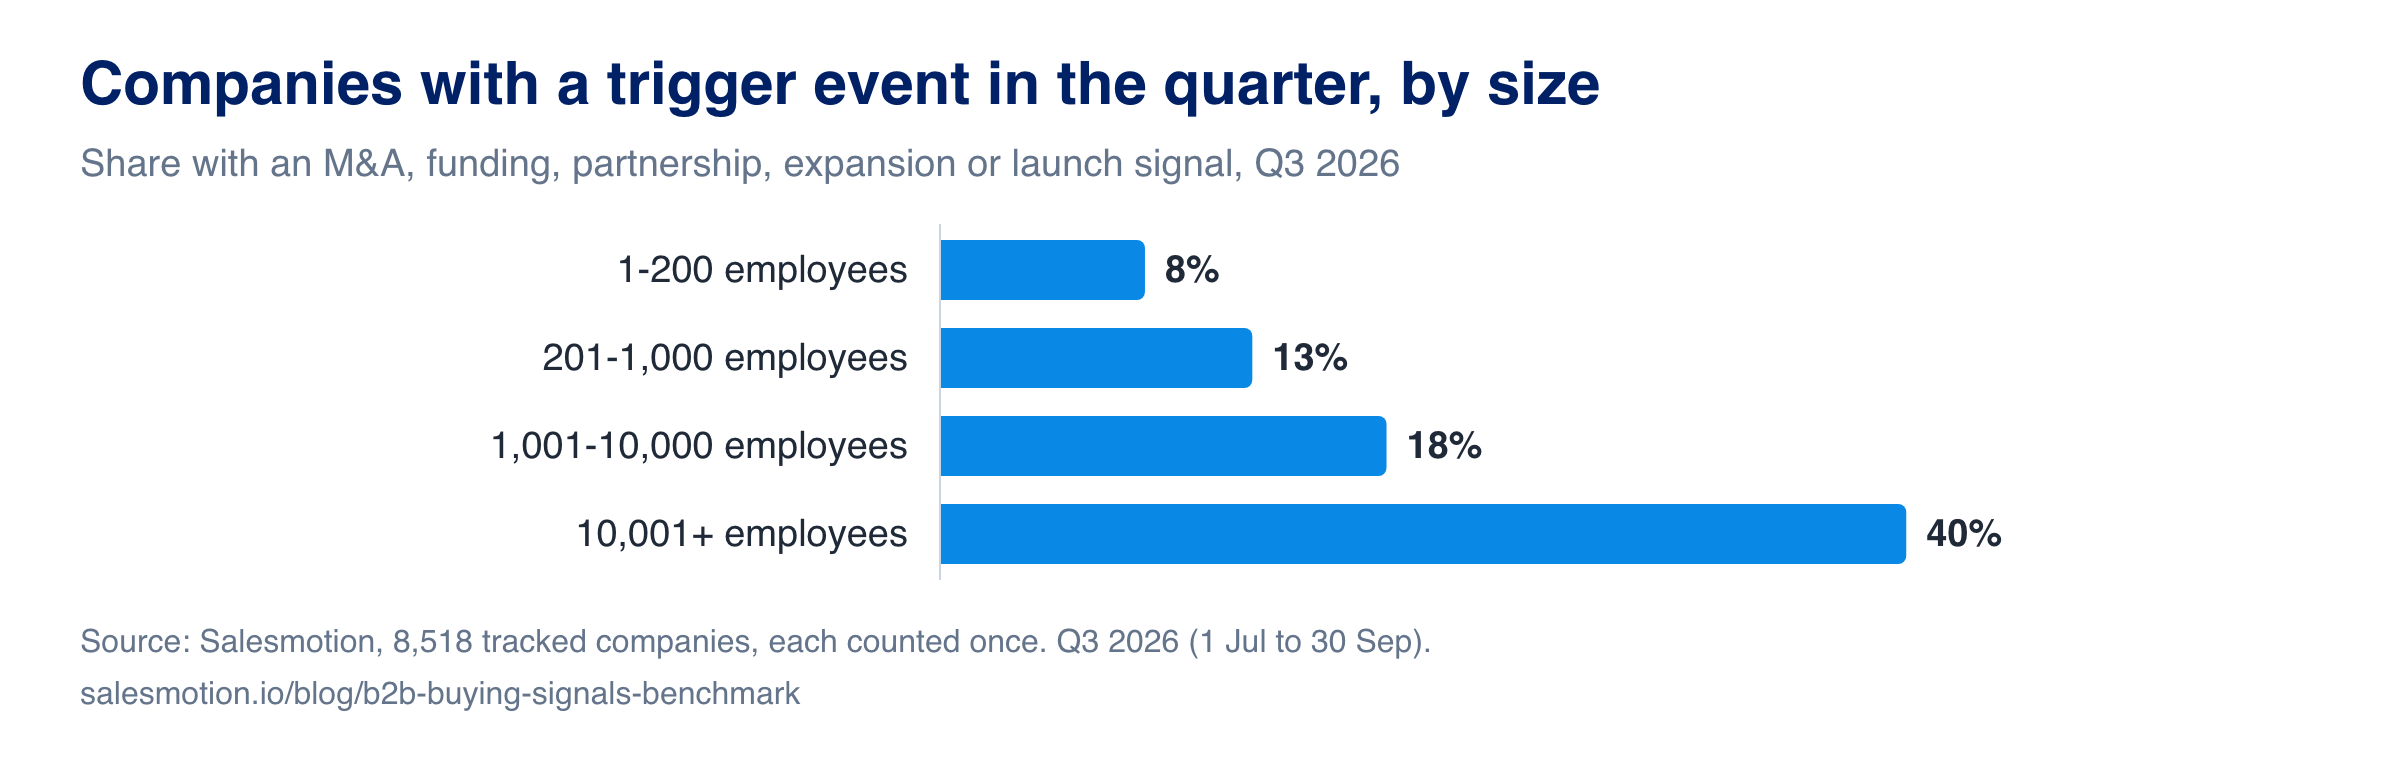
| Employees | Companies | Signals per 100 companies | Trigger events per 100 companies | Share with a trigger event | Median signals per company |
|---|---|---|---|---|---|
| 1 to 200 | 1,226 | 562 | 22 | 8.4% | 1 |
| 201 to 1,000 | 1,927 | 816 | 34 | 12.8% | 3 |
| 1,001 to 10,000 | 3,847 | 1,451 | 54 | 18.3% | 8 |
| 10,001+ | 1,354 | 3,536 | 135 | 39.6% | 32 |
Large enterprises generate more than six times the signal volume of small companies. That changes how to work each segment:
- Enterprise books (10,001+ employees) are noisy. The job is filtering: decide which three or four signal types matter for your offer and ignore the rest.
- Small-company books (200 or fewer) are quiet. The median small company produced one signal in the quarter. Signals alone will not fill a pipeline here, so pair them with fit-based targeting and steady account coverage.
Buying Signals by Industry
Industries with fewer than 300 companies in the dataset are not shown.
| Industry | Companies | Signals per 100 companies | Trigger events per 100 companies | Relevant hiring per 100 companies | Share with a trigger event |
|---|---|---|---|---|---|
| Software and internet | 1,149 | 2,047 | 76 | 143 | 23.3% |
| Financial services | 909 | 1,773 | 78 | 87 | 22.0% |
| Energy and utilities | 366 | 1,657 | 48 | 21 | 16.7% |
| Manufacturing and industrial | 1,489 | 1,482 | 58 | 61 | 17.9% |
| Retail and consumer | 1,057 | 1,425 | 51 | 66 | 19.6% |
| Pharma, biotech and life sciences | 1,228 | 1,198 | 45 | 79 | 16.9% |
| Professional services | 356 | 1,167 | 30 | 50 | 13.2% |
| Other industries | 1,162 | 1,097 | 40 | 30 | 15.7% |
Software companies produce the most hiring signals (143 relevant postings per 100 companies), about seven times the rate in energy and utilities. In life sciences, trial updates add a signal stream most industries do not have; see biotech companies by modality and phase for that side of the data.
Buying Signals Examples You Can Act On
| Signal | Example | What it usually means |
|---|---|---|
| Leadership change | A new CRO or VP of Sales joins from a competitor | New leaders review their stack and priorities in their first months |
| M&A | The account acquires a company in an adjacent market | Integration work, duplicate tools and new budget owners |
| Funding round | A Series C closes "to expand into Europe" | Hiring and new tooling tied to the stated plan |
| Relevant hiring | Five open roles for the team your product serves | The team is growing into the problem you solve |
| Earnings call | The CFO names "sales productivity" as a 2027 priority | An executive priority you can quote back |
| Regulatory decision | A product approval or a new compliance rule | Launch work, new processes, new vendors |
| Partnership | A new alliance with a larger platform | Integration projects and a new channel to sell through |
| Product launch | A new product line goes to market | New go-to-market needs and new buyers |
How to Use These Benchmarks
- Size your book to the signal rate. If one in five accounts produces a hard trigger each quarter, and one in three counting relevant hiring, a 100-account book gives a rep roughly 20 to 30 accounts with a clear reason to call per quarter. Plan steady coverage for the rest.
- Write plays for the common triggers first. M&A and relevant hiring are the most frequent; add a verified new-leader play, because executive news is everywhere but real changes need checking. Funding and partnerships are rare.
- Treat podcast, news and financial-results signals as research. They improve the message. They rarely justify the outreach on their own.
- Expect quiet small accounts. For companies under 200 employees, combine signals with fit and coverage, or the pipeline will stall.
Salesmotion's agents do this monitoring across 1,000+ public sources and 50+ signal types. To see your own accounts measured the same way, book a 30-minute demo.
Methodology
Source. Salesmotion's production database, read on 22 October 2026. Aggregate counts only; no customer, workspace or account list is identified.
Companies. 8,518 companies tracked continuously by 18 Salesmotion customer workspaces from before 1 October 2025 to the end of September 2026, in workspaces whose accounts were still refreshing in September 2026. Internal, test and demo workspaces are excluded, as are deleted and hidden accounts. A company tracked by several workspaces is counted once, through one tracking account (the earliest added, chosen without regard to its signal volume). Two workspaces account for 71% of the companies, so the mix leans toward their target markets: mid-size and large companies in software, manufacturing, retail, financial services and life sciences.
Signals. Every signal Salesmotion created for those accounts with an event date in the period. The same underlying item (article, posting, filing or call) counts once per company. Excluded: closed job postings, and alerts built on a workspace's custom keyword rules.
Period. The headline figures use Q3 2026 (1 July to 30 September 2026). Two signal types widened their coverage during 2026 (relevant hiring and podcast or video mentions), and news categories have been labelled consistently only since May 2026, so earlier quarters are not comparable for those measures. Days between signals use May to September 2026. The CSV includes quarter-by-quarter figures for the measures that are comparable across the year.
Definitions.
- Relevant news is an article Salesmotion's relevance model linked to the seller's offer. What counts as relevant differs by seller, so news volume reflects what sellers care about as well as what happened.
- Relevant hiring is a new job posting for the roles a workspace chose to watch.
- Trigger event is a news signal categorised as M&A, funding or IPO, partnership, expansion or new market, or product launch. Each news signal carries one category, so an article about a partnership that the model filed under strategy counts as strategy; trigger counts are therefore floors. A hand check of 15 to 17 headlines per category found that these five categories mostly describe the event named. The leadership category covered executive news in general, with about a third of sampled headlines being appointments or departures, and the regulatory category mixed approvals with lawsuits and commentary, so both are reported as context.
- Company size and industry come from Salesmotion's company records. 164 companies without a headcount and 114 without an industry are left out of those tables. Industries are grouped into ten groups; groups under 300 companies are not reported.
Download. b2b-buying-signals-benchmark.csv holds every aggregate on this page, with the number of companies behind each figure.
Frequently Asked Questions
What are buying signals in B2B sales?
Buying signals are public events at a target account that change what it needs or when it will buy: acquisitions, funding, partnerships, expansions, product launches, hiring for a specific team, leadership changes and earnings commentary. In this benchmark, 85% of tracked companies produced at least one buying signal in a quarter.
What are sales trigger events?
Sales trigger events are the buying signals that usually open a buying window, such as M&A, funding, a partnership, an expansion or a product launch. 18.7% of the 8,518 companies tracked here had at least one in Q3 2026, and 30.8% did when relevant hiring is counted too.
What is the most common sales trigger event?
M&A. 9.9% of tracked companies had an acquisition, merger or divestiture story in a single quarter, ahead of funding (4.3%) and product launches (3.2%). Leadership and executive news reached 43% of companies, but only about a third of those stories were actual appointments or departures.
How many buying signals should I expect per account?
The median tracked company produced 7 signals in a quarter, but the average was far higher because large enterprises generate most of the volume. The median company with 10,001+ employees produced 32 signals in the quarter; the median company with 200 or fewer produced one.
How often do trigger events happen at the same account?
At companies with at least two trigger events, the median gap between them was 10.5 days (May to September 2026). The middle half of those companies saw a new trigger every 3 to 30 days.
Can I download the benchmark data?
Yes. The CSV contains every aggregate on this page with its period and sample size. Cite it as "Salesmotion B2B Buying Signals Benchmark, October 2026".