Most sales teams score leads. Far fewer score accounts. And it shows.
When I was building sales teams at Salesforce, I watched reps chase individual MQLs while entire buying committees at high-fit accounts went unnoticed. One rep spent weeks nurturing a marketing manager at a mid-market company. Meanwhile, three directors at a Fortune 500 account had quietly visited the pricing page, attended a webinar, and posted a VP of Revenue Operations job. No one noticed because the account scoring model did not exist.
Account scoring is how you fix that blind spot. It evaluates and ranks accounts by fit, intent, and engagement so your team works the right accounts at the right time, not the loudest individual lead.
TL;DR: Account scoring ranks B2B accounts by fit, intent, and engagement to prioritize sales effort at the account level, not the individual level. The best models combine firmographic fit with real-time signals like leadership changes, hiring surges, and earnings commentary. Static scoring models decay fast. Signal-enriched scoring is what separates teams that hit quota from teams that chase ghosts.
Why Account Scoring Matters More Than Lead Scoring in Enterprise B2B
Lead scoring evaluates individuals. Account scoring evaluates the organization. In enterprise B2B, the distinction matters because buying decisions are made by committees, not individuals.
According to Gartner, the average B2B buying committee now includes 6 to 13 decision-makers across IT, finance, procurement, and the business unit. A rising engagement score across multiple roles beats one hyperactive champion. A low score with high activity from one person usually signals a future stall.
Here is the practical difference. Lead scoring might flag a marketing coordinator who downloaded three whitepapers. Account scoring would flag that the same company also had a new CRO start last month, posted five SDR roles, and mentioned "sales transformation" in their latest earnings call. The coordinator matters less than the pattern.
Lead scoring asks: "Is this person worth a call?" Account scoring asks: "Is this company entering a buying window?" For account-based selling teams managing territories of 50 to 500 accounts, the second question is the one that drives pipeline.
That is why 71% of B2B organizations now implement an ABM strategy, and ABM programs report sales cycles that are roughly 28% faster. The shift from individual leads to account-level prioritization is not theoretical. It is how the highest-performing teams already operate.
See Salesmotion on a real account
Book a 15-minute demo and see how your team saves hours on account research.
How to Build an Account Scoring Model
A practical account scoring model combines four dimensions. Each answers a different question about the account.
Fit Score: Does This Account Match Your ICP?
Fit measures how closely the account matches your ideal customer profile. This is the foundation. Strong fit without intent means the account is worth watching. Strong intent without fit means the account will churn.
Key fit attributes:
- Industry vertical (is this a market you serve well?)
- Company size (employee count, revenue range)
- Technology stack (do they use complementary tools?)
- Geographic presence (can you support them?)
- Organizational structure (do they have the function you sell into?)
Score fit on a 0-25 scale. Companies that match three or more ICP attributes score 15+. Companies outside your ICP entirely score below 5 and should not consume rep time.
Engagement Score: Are They Paying Attention?
Engagement tracks how the account interacts with your brand across all contacts. This is where account scoring diverges from lead scoring most sharply. Instead of tracking one person, you aggregate engagement across every known contact at the account.
Signals to track:
- Website visits from multiple contacts at the same account
- Content engagement (whitepapers, case studies, blog visits)
- Email opens and clicks across contacts
- Event attendance (webinars, conferences, roundtables)
- Ad engagement (repeated clicks on targeted campaigns)
Score engagement on a 0-25 scale. A single blog visit from one contact scores low. Three contacts from the same account hitting your pricing page in the same week scores high.
Intent Score: Are They Actively Researching Solutions?
Intent goes beyond your own channels. It captures what the account is doing across the web, tracked through third-party intent data providers and public signals.
Intent signals include:
- Third-party research activity (topic surges on G2, TrustRadius, review sites)
- Job postings that signal strategic initiatives (hiring for a role your product supports)
- Competitive mentions (searching for your category or competitors)
- Buying signals such as funding rounds, M&A activity, or leadership changes
Score intent on a 0-25 scale. An account researching your category on G2 while hiring for a relevant role gets 20+. An account with no detectable research activity gets 0.
Opportunity Score: How Far Along Are They?
Opportunity scoring adds deal-stage and relationship context for accounts already in your pipeline. This prevents your scoring model from treating a $500K deal in negotiation the same as a cold account.
Factors:
- Current deal stage (weighted by historical close rates per stage)
- Number of stakeholders engaged (multi-threading = higher score)
- Recent meeting activity (momentum vs. stalled)
- Champion strength (is your champion still at the account, still engaged?)
Score opportunity on a 0-25 scale. An account with an active champion, three stakeholders engaged, and a deal in technical evaluation scores 20+. A stalled deal with no stakeholder activity in 30 days drops to 5.
Total account score = Fit + Engagement + Intent + Opportunity (0-100).
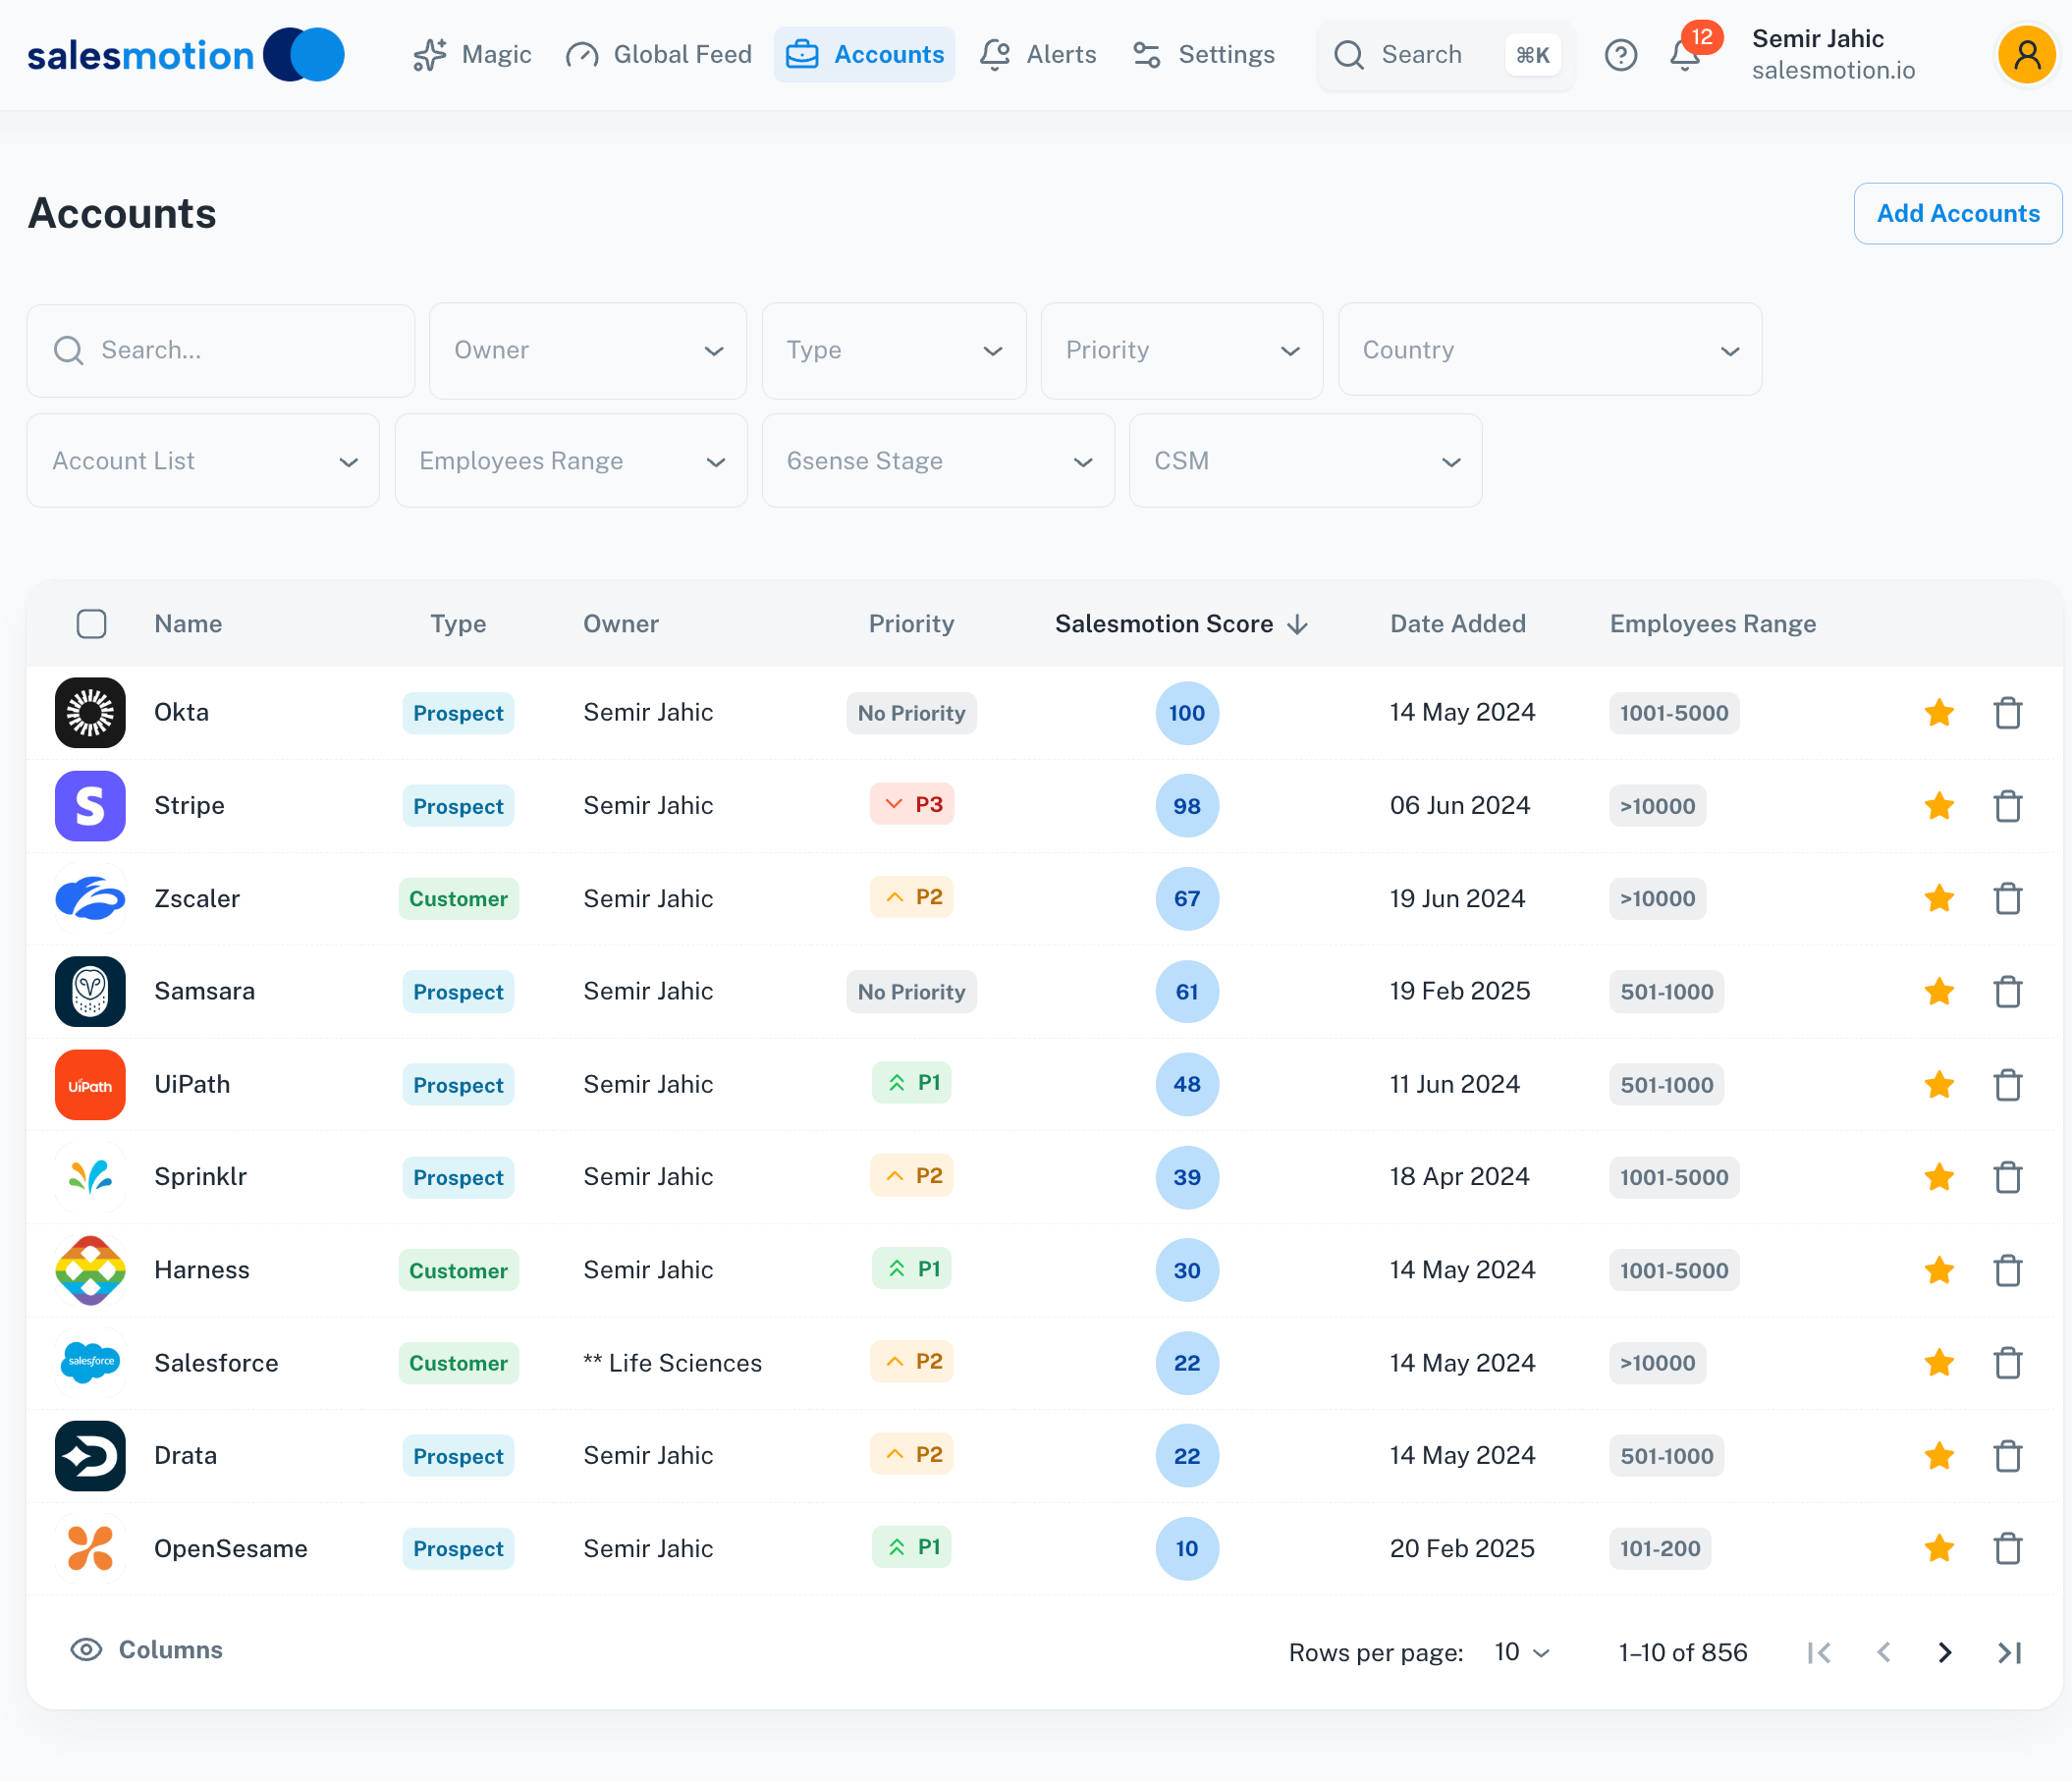 An account scoring model in practice: accounts ranked by composite score, so the 100 and 98 scores get worked first while accounts below 30 stay in nurture.

“We're no longer fishing. We know who the right customers are, and we can qualify them quickly. Salesmotion has had a direct impact on pipeline quality.”
Andrew Giordano
VP of Global Commercial Operations, Analytic Partners
Scoring Methodologies: From Simple to Predictive
Not every team needs machine learning. The right methodology depends on your data maturity and team size.
Point-Based Scoring
The simplest approach. Assign fixed point values to each attribute and behavior. A VP title is worth 10 points. A pricing page visit is worth 15. A demo request is worth 25. Add them up.
Pros: Easy to build, easy to explain to reps, works with any CRM. Cons: Breaks down at scale. You are guessing which weights matter. A pricing page visit from a company outside your ICP gets the same points as one from a perfect-fit enterprise account.
Tiered Scoring (A/B/C Model)
Group accounts into tiers based on a combination of fit and intent. A-tier accounts get full sales coverage. B-tier accounts get targeted outreach. C-tier accounts go into nurture programs.
Pros: Simple to operationalize. Reps know exactly how to allocate time. Works well with territory management. Cons: Tier boundaries are arbitrary. A B+ account behaves very differently from a B- account, but both get the same treatment.
Weighted Formula Scoring
Assign different weights to each scoring dimension based on historical win data. If your data shows that intent signals are 3x more predictive than firmographic fit alone, weight intent at 40% and fit at 20%.
Pros: More accurate than flat point-based systems. Reflects what actually predicts revenue in your business. Cons: Requires historical data analysis to set weights. Weights need periodic recalibration as your market and product evolve.
Predictive Scoring (ML-Based)
Machine learning models analyze your closed-won and closed-lost deals to find patterns humans miss. According to Forrester, B2B organizations using predictive analytics see a 4-5x increase in lead-to-opportunity conversion rates and 3x higher close rates.
Pros: Surfaces non-obvious signals. Self-adjusting over time. Handles complex variable interactions. Cons: Requires clean historical data (at least 12-18 months of deal outcomes). Black-box models can erode rep trust if they cannot see why an account scored high.
For most mid-market teams, start with weighted formula scoring. Layer in predictive scoring once you have 200+ closed deals with clean outcome data.
Why Static Scoring Models Fail: The Signal Gap
Here is where most account scoring models break down. They rely on static attributes and periodic engagement snapshots. They miss timing.
Consider this scenario. Your model scores Acme Corp at 85/100 because they match your ICP perfectly and three contacts visited your website last quarter. But last quarter was when they were in active evaluation. The VP of Sales who championed the evaluation left two weeks ago. The new VP has different priorities. Your model still says 85.
Meanwhile, Beta Inc scores 62/100. Average fit, minimal website engagement. But yesterday, Beta Inc posted four SDR roles, their CEO mentioned "sales productivity" on an earnings call, and a former customer just joined as their CRO. Your model says 62 because none of those signals feed into it.
This is the signal gap. Static firmographics and historical engagement tell you what an account was. Real-time signals tell you what an account is becoming.
The signals that matter most for scoring:
- Leadership changes (new CRO, VP Sales, or VP Marketing often means new vendor evaluations within 90 days)
- Earnings call language (mentions of "transformation," "efficiency," or "consolidation" signal active priorities)
- Hiring surges (posting roles in the function you sell into means budget is allocated)
- Funding events (fresh capital often accelerates tool purchases)
- Competitive signals (mentions of competitors or category research)
Salesmotion monitors these signals across your entire territory and surfaces them in real time. Instead of manually checking LinkedIn, SEC filings, job boards, and news feeds for each account, the platform aggregates 50+ signal types from 1,000+ sources and updates account profiles automatically. When Beta Inc posts those SDR roles and their CEO mentions sales productivity, the account brief updates within hours, not quarters.
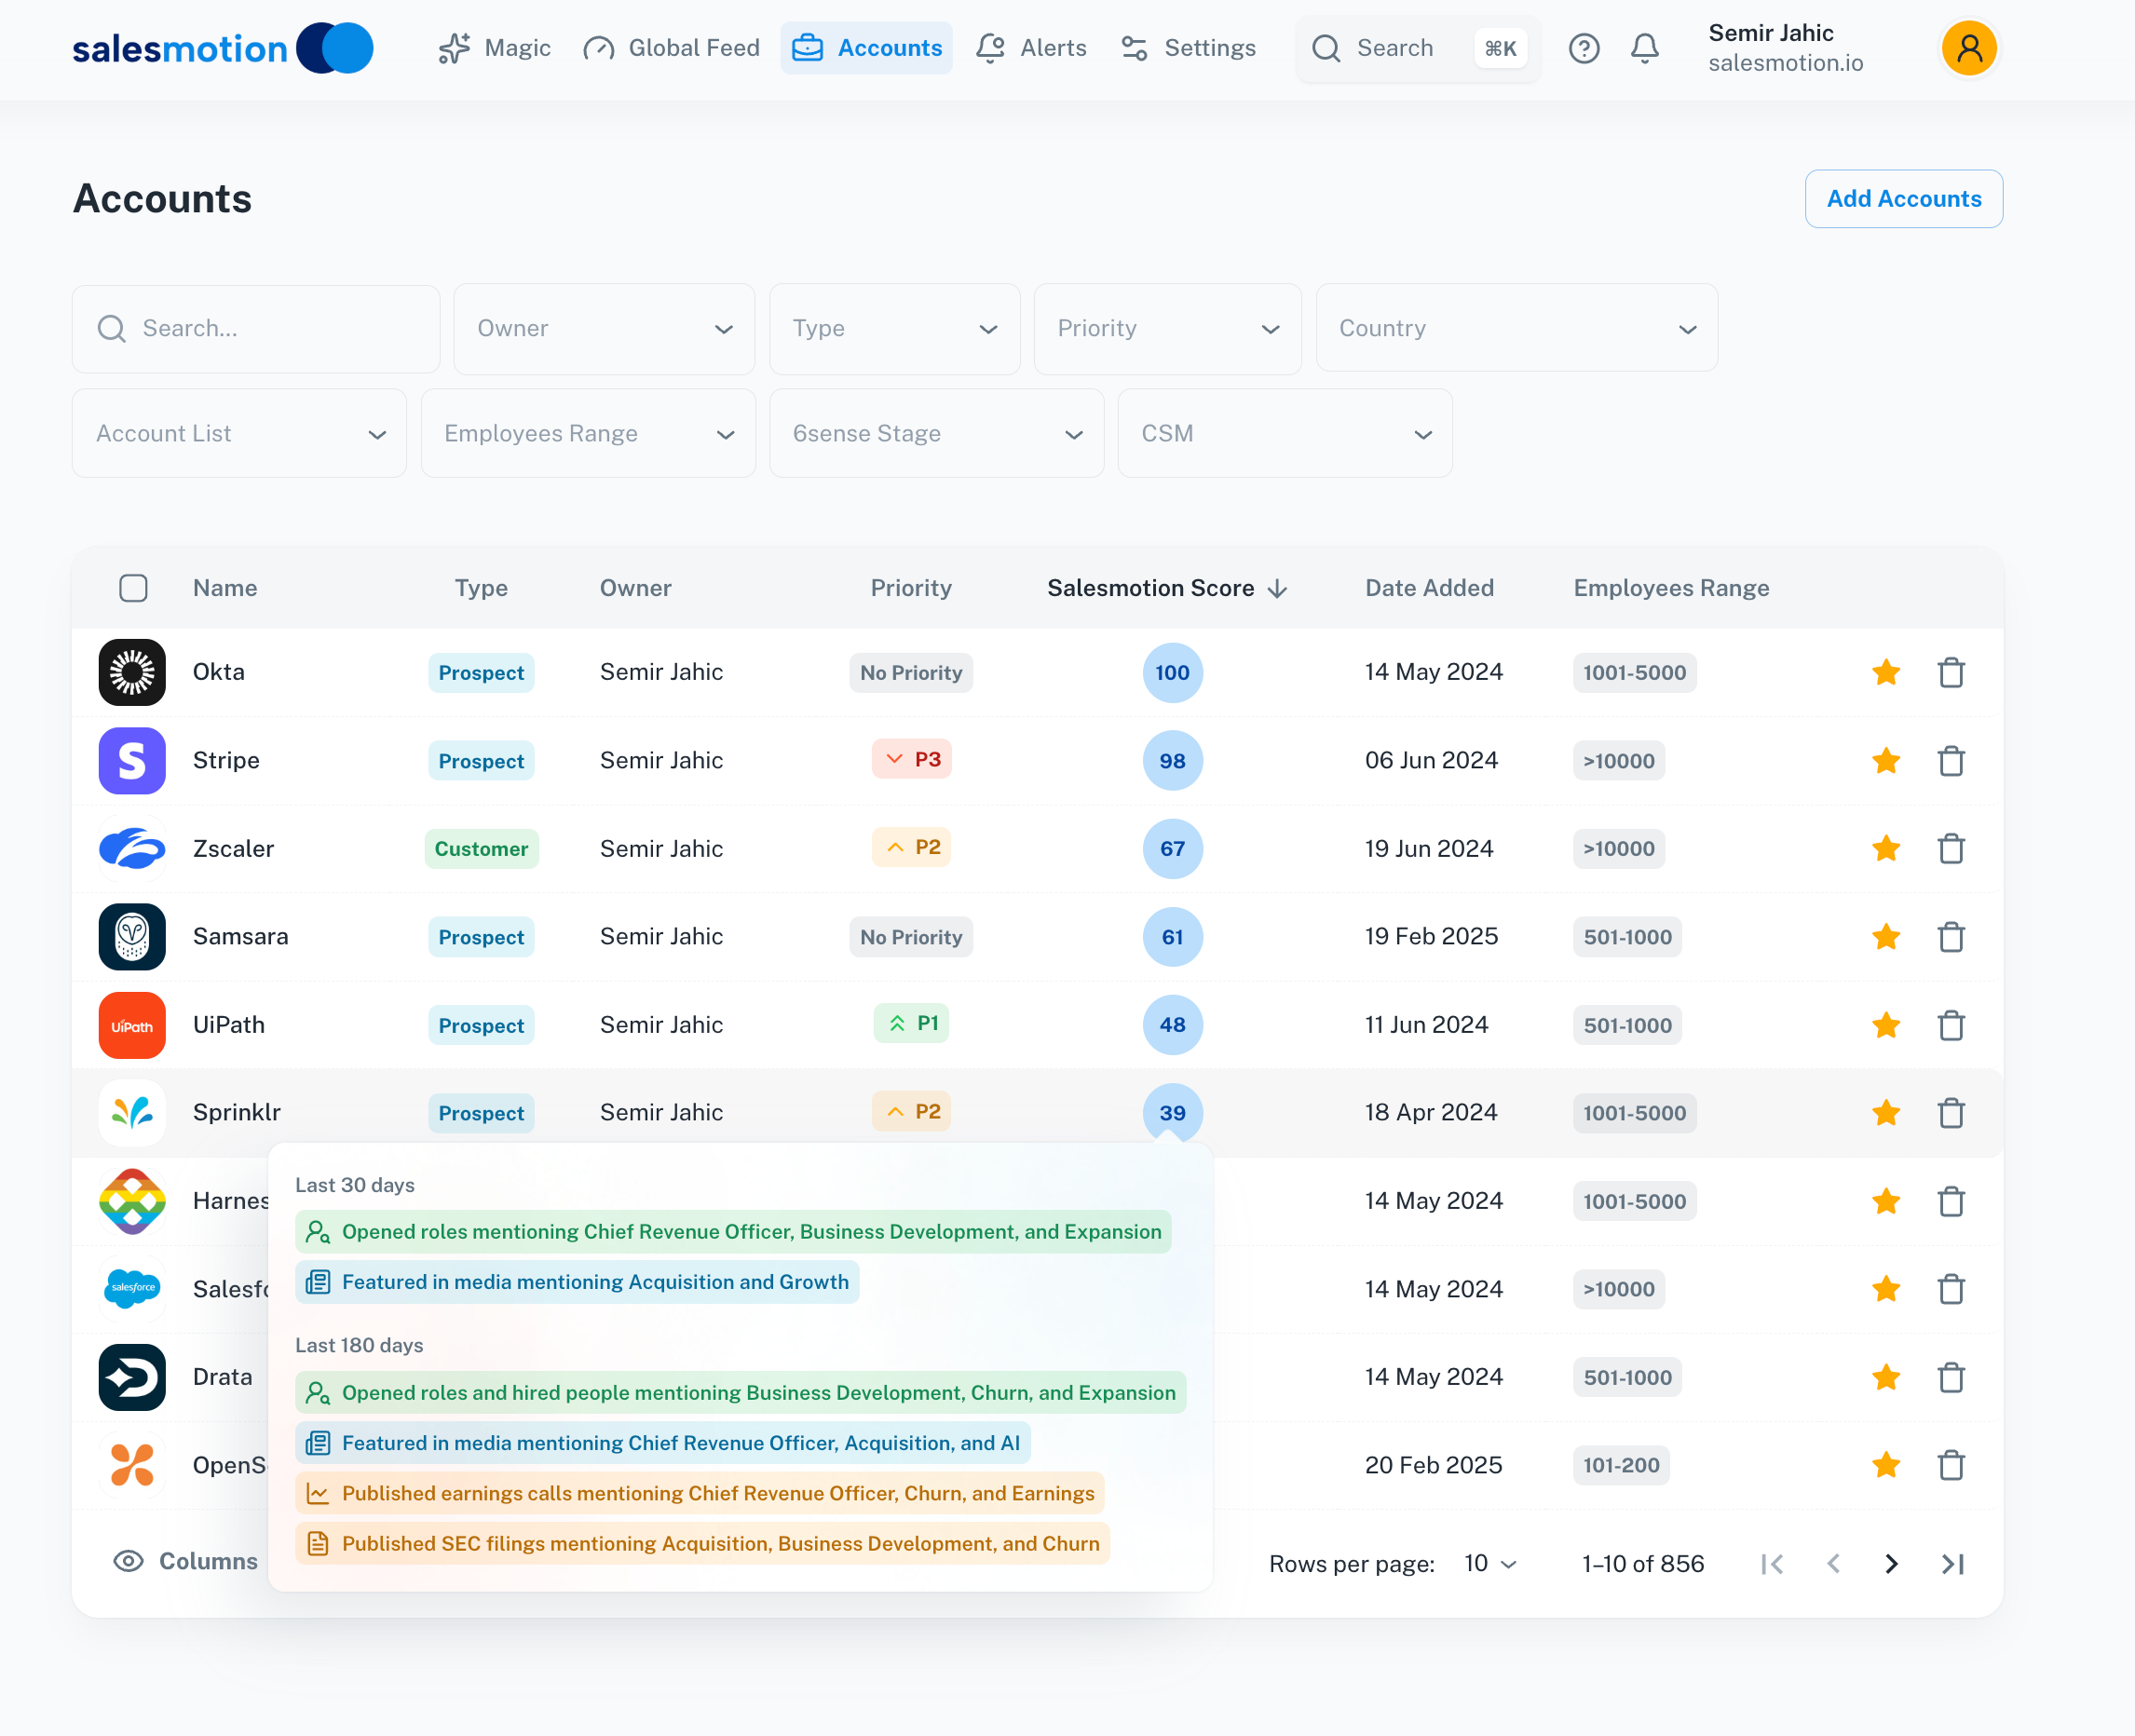 Expanding a score shows the signals behind it: roles opened mentioning a Chief Revenue Officer, earnings call language, and SEC filings from the last 30 and 180 days.
The workflow shift looks like this: A signal fires (new CRO joins Beta Inc). The platform flags the account and surfaces context (the CRO previously used your category of product, the company just raised Series C, the earnings call mentioned scaling the sales team). The rep enters outreach already knowing the likely pain, the key stakeholders, and the timing. Instead of a generic intro email, the first touch references the CRO's priorities. That is how signal-based selling converts scoring from a static label into a dynamic prioritization engine.
Teams at Analytic Partners grew qualified pipeline by 40% year-over-year after moving from static research to signal-enriched account intelligence. Their reps get 80-90% of what they need in 15 minutes, a shift that directly impacts which accounts get worked and when.

“Salesmotion helps you spot signals from prospect accounts, news items / job hiring alerts etc that indicate that now is a good time to reach out with a well-crafted message.”
Rob Douglas
Director of Sales, icit business intelligence
Common Account Scoring Mistakes (and How to Avoid Them)
After seeing dozens of teams implement account scoring, these are the patterns that consistently undermine the model.
Over-Weighting Firmographics
A company matching your ICP perfectly does not mean they are ready to buy. Fit is necessary but not sufficient. If 60% of your score comes from firmographics, your model will surface accounts that look right but are not in a buying window. Rebalance so fit accounts for no more than 25-30% of the total score.
Ignoring Score Decay
Engagement from six months ago should not carry the same weight as engagement from last week. Implement time-based decay: full points for activity in the last 30 days, 75% for 31-60 days, 50% for 61-90 days, and zero beyond 90 days. Without decay, your model accumulates stale scores and reps chase accounts that have gone cold.
Not Incorporating Timing Signals
This is the most common gap. Most models score based on what happened. The best models score based on what is happening right now. Leadership changes, earnings commentary, hiring patterns, and funding events are among the most predictive signals for purchase timing, yet most scoring models ignore them entirely because the data lives outside the CRM.
Scoring Too Many Accounts
If everything is a priority, nothing is. Effective account scoring requires ruthless account prioritization. Limit your actively scored and worked accounts to a number your team can realistically cover. For most mid-market teams, that is 50-150 accounts per rep. Score everything, but only route the top tier for active sales coverage.
No Feedback Loop
A scoring model that never updates is a scoring model that degrades. Build a monthly review process: compare scores against actual pipeline creation and closed deals. If high-scoring accounts are not converting, your weights are wrong. If low-scoring accounts are closing, your model is missing a signal. The lead qualification process should feed back into scoring refinement.
Implementing Account Scoring in Your CRM
Account scoring only works if it lives where reps work. Here is how to operationalize it in the two most common B2B CRMs.
Salesforce Implementation
Salesforce supports account scoring natively through custom fields and automation:
- Create a custom Account Score field (number, 0-100) on the Account object
- Build scoring components as formula fields: Fit Score, Engagement Score, Intent Score, Opportunity Score
- Use Flow or Process Builder to calculate the composite score and update it on a scheduled basis
- Create account views and reports filtered by score ranges (A: 75+, B: 50-74, C: 25-49)
- Set up alerts so reps are notified when an account crosses a tier threshold
For signal data, the challenge is getting real-time signals into Salesforce fields. Salesmotion's Salesforce integration syncs account intelligence and signals directly into the CRM, so scoring models can incorporate real-time data without reps leaving their workflow.
HubSpot Implementation
HubSpot's company scoring properties allow you to build account-level scores directly:
- Use HubSpot's built-in company scoring tool to assign points based on company properties and associated contact activity
- Create calculated properties that aggregate engagement across all contacts at a company
- Build active lists segmented by score ranges for targeted outreach sequences
- Set up workflows that trigger when accounts cross scoring thresholds (notify the account owner, enroll in a sequence, create a task)
The key gap in both CRMs is real-time signal data. Native scoring covers fit and engagement well. Intent and timing signals require either manual updates (unsustainable at scale) or an integration with a platform that monitors and delivers those signals automatically.
Key Takeaways
- Account scoring ranks entire organizations by fit, intent, and engagement. This matters in enterprise B2B because buying committees, not individual leads, make purchasing decisions.
- Build scores across four dimensions: fit (ICP match), engagement (brand interaction), intent (research activity), and opportunity (deal stage). Weight each based on your historical conversion data.
- Static scoring models decay fast. Incorporate real-time signals (leadership changes, earnings calls, hiring surges, funding) to capture timing, the most predictive element of account readiness.
- Start with weighted formula scoring if you have limited data. Move to predictive models once you have 200+ closed deals with clean outcome data.
- Implement score decay (full points at 30 days, 75% at 60, 50% at 90) so stale engagement does not inflate account scores.
- Operationalize scoring in your CRM with tiered views, threshold alerts, and signal integrations so reps act on scores without leaving their workflow.
Frequently Asked Questions
What is account scoring?
Account scoring is the process of ranking B2B accounts by how likely they are to buy, using a composite score built from ICP fit, engagement, intent, and opportunity data. Unlike lead scoring, it evaluates the whole organization rather than individual contacts. Most models use a 0-100 scale and route the highest-scoring accounts to reps for active coverage.
What is the difference between account scoring and lead scoring?
Lead scoring evaluates individual contacts based on their attributes and behavior. Account scoring evaluates entire organizations by aggregating fit, intent, and engagement signals across all known contacts and external data sources. In enterprise B2B where buying committees average 6 to 13 stakeholders per deal, account scoring provides a more accurate picture of purchase readiness than any individual lead score can.
How many signals should an account scoring model include?
Start with 10-15 signals across your four scoring dimensions (fit, engagement, intent, opportunity). More signals create complexity without necessarily improving accuracy. The key is selecting signals that correlate with your actual closed-won deals. Review quarterly and remove signals that do not predict outcomes.
How often should account scores be recalculated?
Fit scores can update monthly since firmographic data changes slowly. Engagement and intent scores should update daily or in real time to capture active buying behavior. Implement time-based decay so scores reflect current activity, not historical engagement. Accounts with no activity in 90 days should see their engagement and intent scores drop toward zero.
Can account scoring work without intent data?
Yes, but it will be less predictive. A model using only fit and engagement can still prioritize better than no model at all. However, intent and timing signals are where the highest-value differentiation happens. Teams that layer in real-time signals like leadership changes, hiring patterns, and buying signals consistently outperform teams relying on firmographic fit alone. According to Forrester, organizations using predictive analytics with intent data see 3x higher close rates than those using traditional scoring.
How do I get executive buy-in for account scoring?
Run a pilot. Score a cohort of 50-100 accounts and route them to reps for focused outreach while tracking a control group with standard prioritization. Measure meeting rates, opportunity creation, and pipeline velocity between the two groups. Hard data from a 60-day pilot is more persuasive than any slide deck. The pilot does not need procurement: Salesmotion's individual plan is $85/mo, self-serve monthly with no annual commitment, so a single rep can test signal-enriched scoring before a team rollout (team plans use custom pricing with unlimited users on team plans).