Want the templates? Jump straight to the Signal-Driven QBR Agenda, the Strategic Account Plan QBR, or the Risk & Renewal QBR. Each one ships with a structure your team can copy into Slides, Notion, or your CRM today.
Quarterly Business Reviews (QBRs) often feel like a look in the rearview mirror—a stale recitation of last quarter's numbers. What if they could be forward-looking, strategic sessions that actually shape future revenue? The problem isn't the QBR itself; it's the data. Most teams rely on lagging indicators, leading to conversations about what happened instead of what’s happening. This model forces teams to spend hours on manual research, only to present generic updates that lack a compelling "why now" for their key accounts.
This guide offers a different approach. We’ll break down 8 practical quarterly business review examples built on real-time account intelligence. You'll see how B2B revenue teams use platforms like Salesmotion to turn QBRs from reactive reports into proactive, signal-driven strategy sessions. For leaders, integrating these real-time data systems is a core part of a modern GTM operation, and a clear AI strategy for executives is critical to shifting from historical reporting to predictive action.
Inside these examples, you'll discover how to:
- Eliminate manual research.
- Define a clear 'why now' for every account.
- Turn intelligence into measurable pipeline.
Let's explore dynamic QBRs that drive meaningful results.
1. The Signal-Driven QBR Agenda Template
This QBR approach moves beyond just reviewing past performance. The Signal-Driven Agenda is for teams using account intelligence platforms to prioritize real-time customer signals. It frames the conversation around proactive, data-informed next steps rather than reactive, historical analysis.
The core idea is to structure the QBR around changes in customer behavior, engagement, and product usage that signal risk or opportunity. Instead of asking, "How did we do last quarter?", this agenda asks, "What signals did we see, and what do they tell us about the quarter ahead?"
Strategic Breakdown
This template is effective because it directly connects daily account activities to long-term strategic outcomes. It forces account managers to think like portfolio managers, constantly assessing each account's health based on fresh data. The discussion shifts from subjective feelings to objective evidence.
For example, a traditional QBR might report, "Account X is at risk." A signal-driven QBR would specify: "Account X showed a 40% drop in user logins over the last 30 days and has not responded to three outreach attempts, flagging them for immediate intervention." This detail makes the resulting action plan far more precise.
Key Insight: A signal-driven QBR transforms the meeting from a historical report card into a forward-looking strategy session. It focuses energy on accounts where momentum is building or stalling, enabling faster, more effective resource allocation.
Actionable Takeaways
To implement this, focus your agenda on these areas:
- Momentum Metrics: Start by examining accounts with the highest positive and negative changes in engagement scores, product adoption rates, or support ticket trends.
- Signal-to-Outcome Analysis: For key wins and losses from the previous quarter, trace them back to the specific signals that preceded the outcome. Did a surge in a feature's use lead to an upsell? Did a drop in communication signal churn risk?
- Proactive Plays: Dedicate at least a third of the QBR to planning proactive "plays" based on current signals. For instance, if an account shows expansion signals (e.g., nearing license limits), the team should define a specific expansion play to run in the next 30 days.
This is one of the most effective quarterly business review examples for teams looking to become more proactive and data-informed.
See Salesmotion in action
Take a self-guided interactive tour — no signup required.
2. AI-Generated Executive Summary with Signal Context
This approach streamlines the QBR with a concise, one-page executive summary for C-suite review. Using AI powered by an account intelligence platform like Salesmotion, it synthesizes quarterly performance and connects it to the real-time customer signals that influenced pipeline and revenue. It answers the leadership question: "How did our go-to-market intelligence impact the bottom line?"
The summary moves beyond basic KPIs by providing context. Instead of just reporting a 15% pipeline increase, it specifies what drove that growth. For example, it might show that funding alerts and key hiring signals generated 28% of new pipeline, outperforming the 12% from traditional outreach. This highlights the ROI of a signal-based sales strategy in a clear, digestible format.
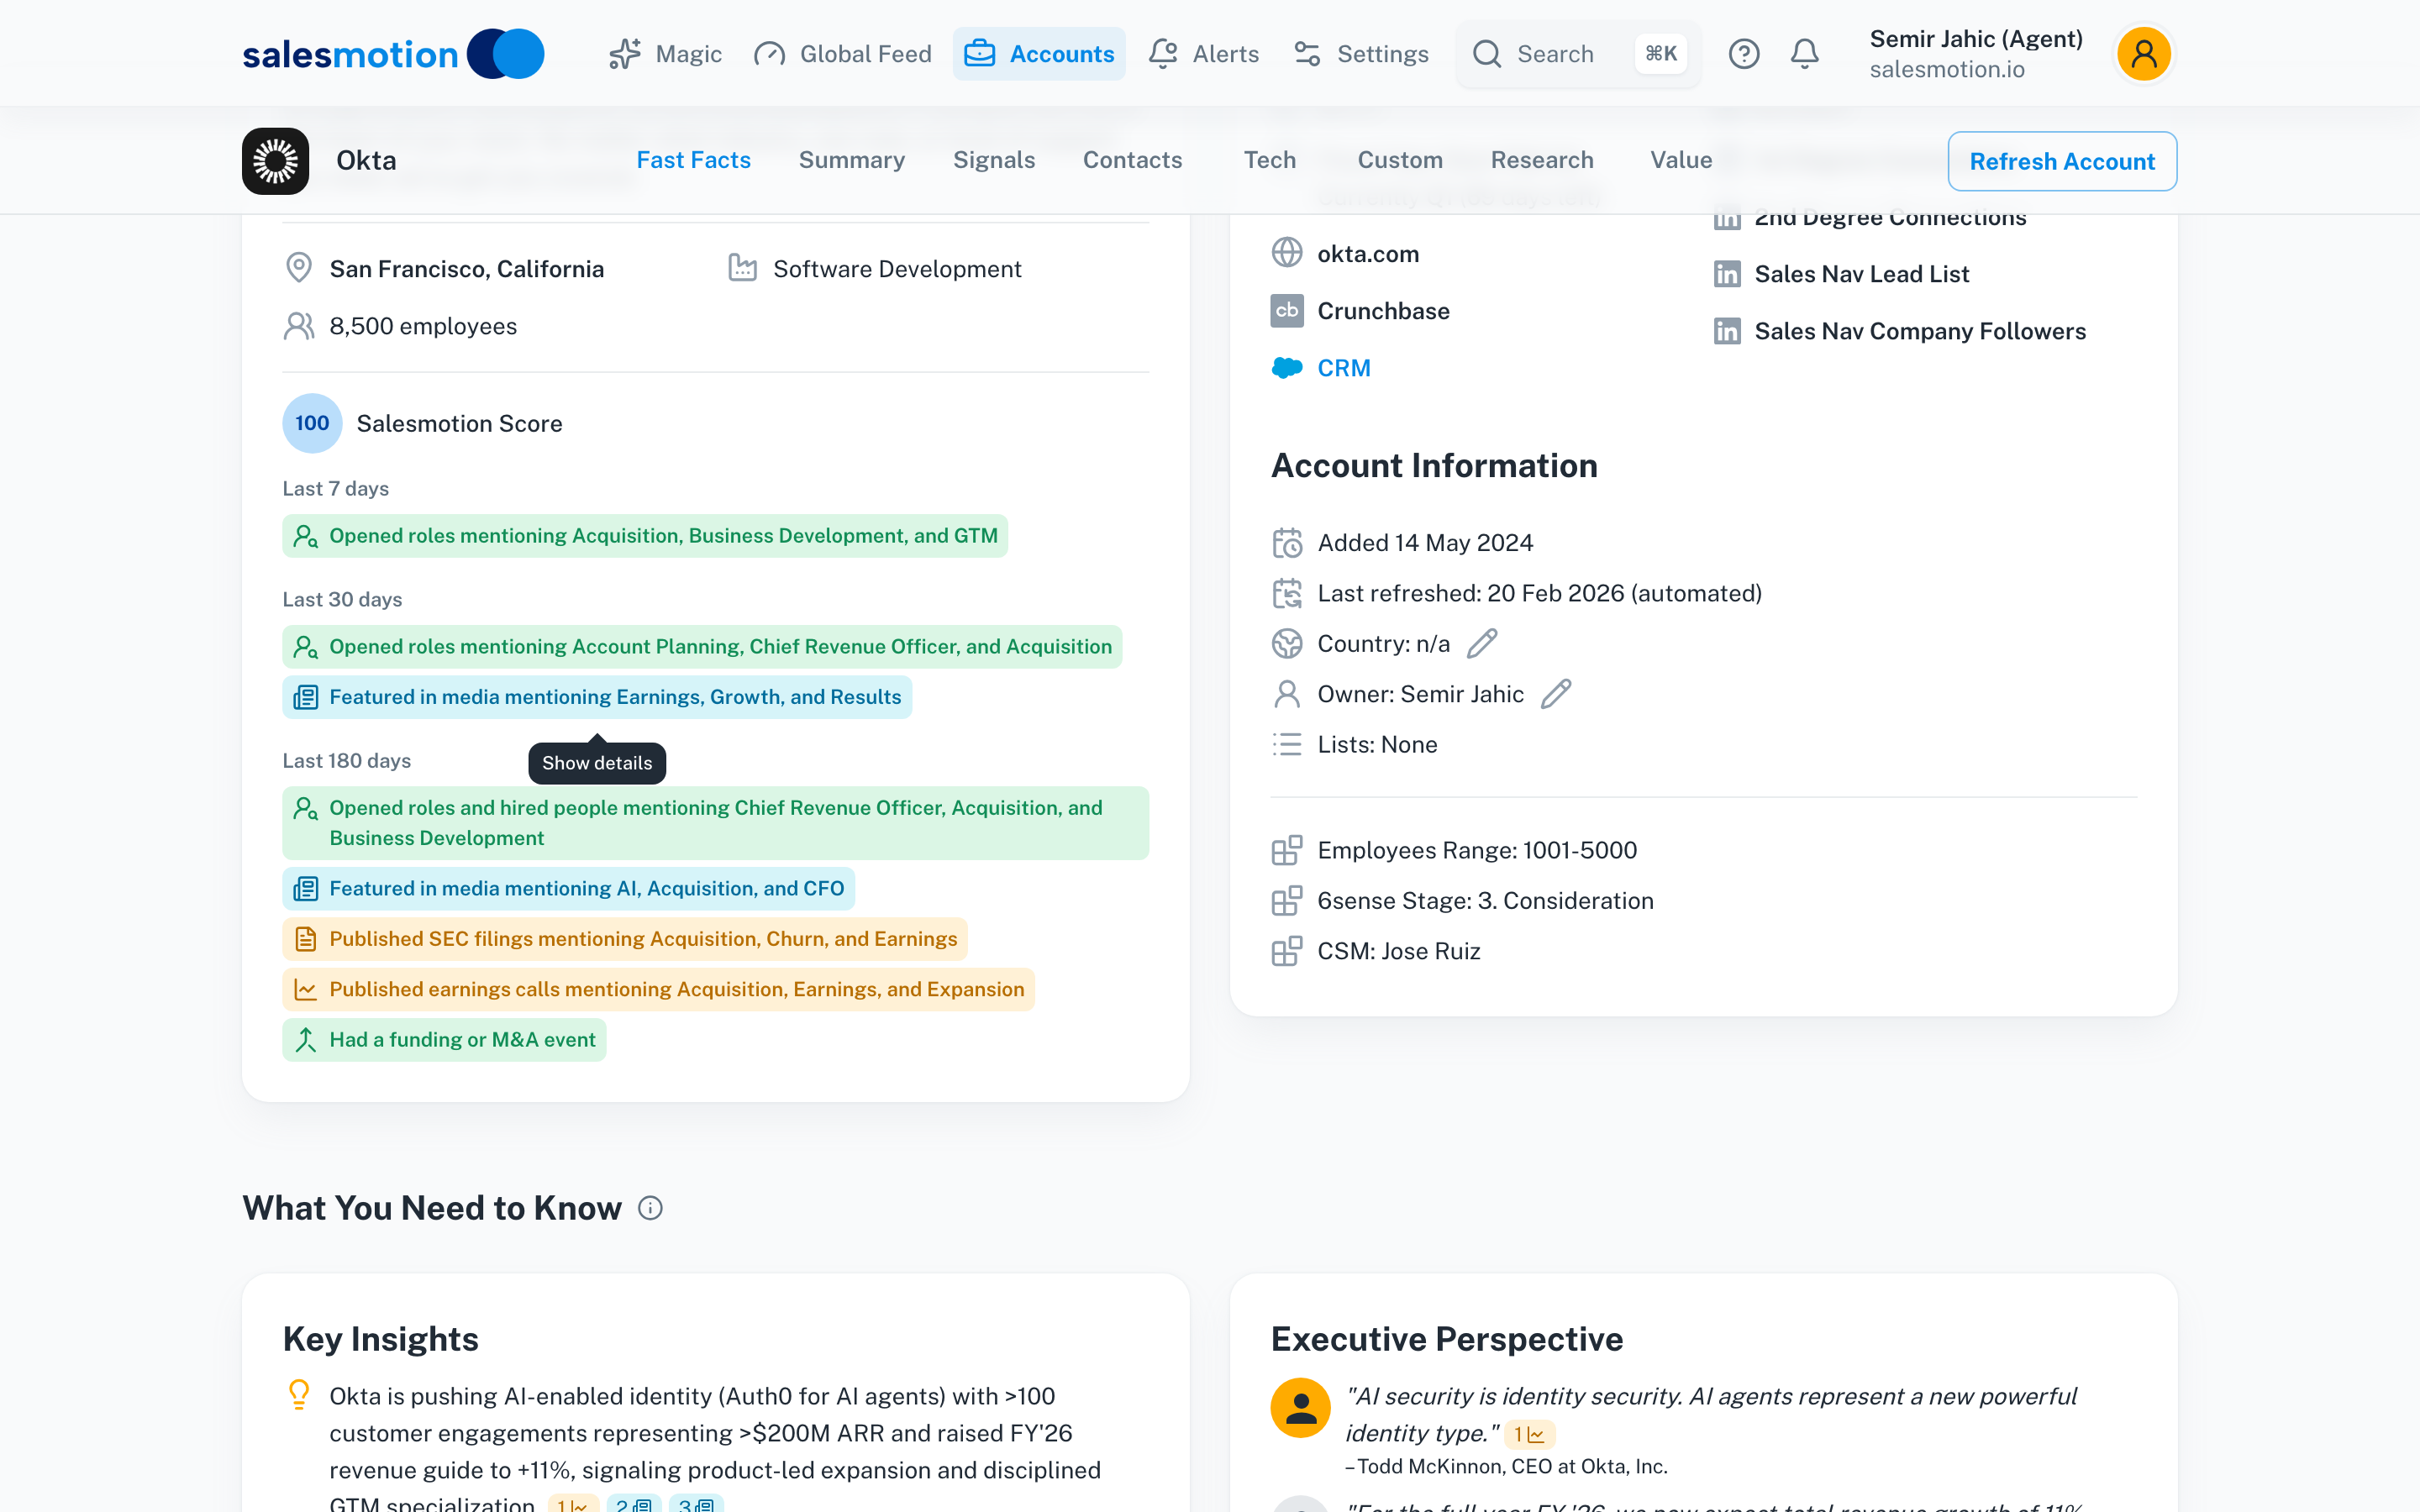 Salesmotion keeps account intelligence current between QBRs — key insights, executive commentary, and signal activity are continuously updated from 1,000+ sources.

Strategic Breakdown
This template is powerful because it translates granular account activities into high-level business impact, making the value of account intelligence tangible for leadership. It shifts the QBR narrative from "what we did" to "how our intelligence enabled us to win." The focus is on quantifiable results that justify investment in data-driven GTM strategies.
For example, a report might state, "Account intelligence reduced time-to-meaningful-conversation by 40%," or "Monitoring competitor executive moves identified 8 high-intent accounts, converting 5 within Q3." This specific, signal-backed evidence makes the QBR a compelling story of strategic success, not just a data dump. If you're looking for guidance, you can find helpful tips on how to write an executive summary for business reviews.
Key Insight: An AI-generated summary with signal context proves the ROI of your intelligence tools. It tells leadership not just that you hit your numbers, but how you used smart, proactive signals to do so more efficiently.
Actionable Takeaways
To build this summary, focus your QBR prep on:
- Signal-to-Revenue Mapping: Directly attribute pipeline and closed-won revenue to specific signal types (e.g., funding, hiring, tech stack changes). Quantify the contribution of each.
- Efficiency Metrics: Showcase the "before and after" impact. Use clear metrics like "Signal-Driven Pipeline Up 34% YoY; Research Time Down 50%" to demonstrate operational improvements.
- Risk & Opportunity Analysis: Conclude with a forward-looking statement that frames account intelligence as a competitive necessity, such as: "Competitors without this visibility are 30% slower to act on similar opportunities."
This is one of the most impactful quarterly business review examples for teams aiming to clearly communicate the value of their GTM intelligence to executives.

“Salesmotion helps you spot signals from prospect accounts, news items / job hiring alerts etc that indicate that now is a good time to reach out with a well-crafted message.”
Rob Douglas
Director of Sales, icit business intelligence
3. KPI Dashboard: Signal Quality & Velocity Metrics
This approach elevates the QBR by focusing on the performance of the account intelligence operation itself. Instead of just reviewing sales outcomes, this KPI dashboard gives a real-time view into the health and impact of your team's signals. It measures signal relevance, coverage, and the speed at which insights are converted into action.

The goal is to move beyond traditional sales KPIs and ask better questions: Are we tracking the right signals? How quickly are reps acting on them? And which signals actually lead to revenue? This dashboard turns your QBR into a diagnostic tool for your entire GTM intelligence strategy.
Strategic Breakdown
This template is powerful because it treats account intelligence as a core business process that can be measured and optimized. It provides a direct feedback loop, showing teams which signals are goldmines and which are noise. The review shifts from discussing individual deals to optimizing the systems that create pipeline.
For instance, a team might discover that "clinical trial completion" signals have a 45% conversion rate to qualified pipeline, while "new executive hiring" signals only convert at 12%. This data allows leaders to retrain reps to prioritize the most valuable alerts, directly impacting sales efficiency and overall pipeline velocity.
Key Insight: A QBR centered on a signal quality dashboard makes your revenue process more predictable. By understanding the leading indicators of success, you can refine your strategy and resource allocation to systematically generate more high-quality opportunities.
Actionable Takeaways
To build this dashboard into your review, focus on these metrics:
- Signal Health Scorecard: Track signal relevance (what percentage of alerts were useful?), coverage (are 75% of named accounts monitored?), and velocity (is the team acting on alerts in under 4 hours?).
- Signal-to-Outcome Performance: Analyze which signal types produce the best results. A consulting firm might find that competitor executive-move alerts have the highest signal-to-deal velocity (22 days average), while restructure alerts yield the highest deal value.
- Rep Engagement and Feedback: Track "signal fatigue" by measuring how many alerts reps ignore. If over 60% of alerts are dismissed, the system needs refinement. Schedule reviews with AEs to gather qualitative feedback and tune alerts.
This is one of the most insightful quarterly business review examples for leaders who want to build a truly scalable and efficient revenue engine.
4. Account Planning Template: Signal-Enriched Strategy Framework
This approach reimagines the static account plan as a dynamic document. The Signal-Enriched Strategy Framework embeds real-time account intelligence directly into the planning process, ensuring your strategy is always relevant. It moves the account plan from a once-a-year exercise to a continuously updated strategic guide.
The concept is to treat account plans not as fixed documents but as frameworks constantly fed by fresh data. When a new signal is detected, like an executive change or a job posting indicating a strategic shift, the account plan is immediately updated. This makes the QBR discussion on account strategy forward-looking and grounded in current reality.
Strategic Breakdown
This template creates a direct line between market intelligence and sales strategy, forcing teams to justify their plans with concrete evidence. It prevents account plans from becoming stale and ensures every initiative is tied to a specific, timely trigger. This shifts the focus from simply having a plan to having an adaptive strategy.
For instance, a conventional plan might state a goal to "expand into the finance department." A signal-enriched plan would be triggered by an alert that the customer just hired a new VP of Financial Planning. The plan would then auto-populate with talking points about modernizing financial systems and suggest immediate outreach, turning a generic goal into a specific, timely action.
Key Insight: By treating account plans as living documents powered by real-time signals, QBRs become a review of strategic agility. The conversation changes from "Did we follow the plan?" to "How did our plan adapt to new intelligence, and what are the signals telling us to do next?"
Actionable Takeaways
To build this dynamic framework, focus your account planning on:
- Initiative-to-Signal Linking: Mandate that every major goal in an account plan is linked to a supporting customer signal. For example, a goal to upsell a new module should be linked to signals like increased usage of a related feature.
- Plan Health Indicators: Introduce a "signal freshness" score for each account plan (e.g., green for plans updated in the last 14 days, red for older than 30). This visually flags which plans are based on stale information.
- Signal-Based Risk Assessment: Create a "plan risk score" based on detected headwinds. Signals like a key champion leaving, negative sentiment in earnings calls, or new partnerships with a competitor automatically increase the risk score, flagging the account for review.
This is one of the most powerful quarterly business review examples for teams making their strategic account planning in sales a continuous, data-driven process.

“Automatic account profile detail I can use to manage my territory. Using Salesmotion AI to generate value statements per persona, account, etc. Using Salesmotion to give me a starting point based on new hires, or news alerts is critical.”
Adam Wainwright
Head of Revenue, Cacheflow
5. Action Plan: From Signal Alert to Closed Deal
This QBR moves beyond discussing what happened and focuses on what to do next. The Action Plan approach is a playbook-driven framework that translates individual signal alerts into concrete, sequenced go-to-market motions. It ensures valuable intelligence doesn't just get discussed; it gets acted upon with speed and precision.
The core concept is to pre-build standardized plays for high-value signals. When a specific trigger occurs, like a competitor's funding announcement, a pre-defined sequence of outreach and messaging is immediately activated. This removes guesswork and standardizes the best practices of your top performers.
Strategic Breakdown
This template creates a direct, repeatable link between market intelligence and pipeline generation. It operationalizes your team’s response to opportunities, ensuring every high-intent signal receives timely and coordinated outreach. The QBR becomes a forum for reviewing playbook performance and refining strategy.
Instead of a generic discussion about "targeting accounts that just got funding," this QBR analyzes hard data: "Our 'Funding Round Close' playbook led to five of our last eight funded accounts entering the pipeline within 45 days." This shifts the conversation from abstract ideas to measurable, scalable sales motions.
Key Insight: A playbook-driven QBR turns strategic discussion into a tactical activation plan. It focuses the team on refining and executing proven plays that convert market signals into qualified opportunities, making revenue generation more predictable.
Actionable Takeaways
To put this into practice, center your QBR discussion on:
- Playbook Performance Review: Dedicate time to analyzing the metrics of your key playbooks. Which ones generate the highest meeting rates or pipeline influence? Which are underperforming?
- Signal-to-Playbook Mapping: Review the top signals from the past quarter. Did you have a playbook ready for them? Identify gaps and prioritize building new plays for recurring, high-impact signals.
- Optimization and Refinement: Use the QBR to gather feedback from the team. Work with top-performing reps to codify their successful tactics into the playbooks. Set response time targets (e.g., act within four hours of an alert) to maintain momentum.
This is one of the most effective quarterly business review examples for teams that want to build a systematic, signal-based engine for pipeline creation.
6. Customer Case Study: Life Sciences Revenue Team - Overview
This QBR example moves from a template to a real-world case study. A mid-market biotech Contract Research Organization (CRO) used account intelligence from Salesmotion to overhaul its review process. Their challenge was a complex sales environment where deals often stalled due to a lack of visibility into the buying committee.
Their previous QBRs were subjective, relying on anecdotal evidence. By integrating Salesmotion, they shifted to tracking stakeholder engagement signals across the entire buying committee. This allowed them to measure influence, identify champions, and spot blockers with data, turning their QBRs into accurate forecasting and strategy sessions.
Strategic Breakdown
This approach is powerful because it addresses the core challenge of B2B sales: navigating the "black box" of the buying committee. The biotech CRO used intelligence to map stakeholder relationships and engagement, which became the centerpiece of their new QBR format. Instead of reviewing deal stages, they reviewed stakeholder maps.
For instance, a deal that appeared healthy (e.g., in the "Proposal" stage) could be flagged as high-risk if their key champion's engagement dropped or a detractor became active. This allowed them to pivot their strategy mid-cycle and de-risk the deal. Their forecast accuracy improved dramatically because it was based on collective account behavior, not just one contact's feedback.
Key Insight: Focusing a QBR on the health of the buying committee, not just the deal stage, provides a more accurate picture of deal health. It makes forecasting a science based on multi-threaded engagement data.
Actionable Takeaways
To apply this model, structure your QBR discussions around:
- Stakeholder Map Review: For each key deal, project the stakeholder map. Discuss changes in engagement, identify new influencers, and confirm your active champions and potential blockers.
- Competitive Intelligence Analysis: The CRO used Salesmotion to track when competitors were mentioned. In your QBR, discuss deals where competitive threats are high and build a strategy to neutralize them based on which stakeholders the competitor is influencing.
- Forecast Justification with Data: Require reps to justify their forecast for each deal using engagement metrics. A "commit" must be backed by evidence of strong, multi-threaded engagement from key decision-makers within the last two weeks.
This is one of the most practical quarterly business review examples for teams selling complex solutions to large buying committees.
7. Customer Case Study: BioServices Results & Financial Impact
This QBR example showcases the tangible outcomes of a signal-driven strategy. The BioServices case study QBR reviews the financial and operational impact of a new go-to-market motion, focusing on results, challenges, and success factors. It’s a powerful tool for leadership to validate investment in new technologies.
The central goal is to connect strategic initiatives, like adopting Salesmotion, to measurable business outcomes. Instead of just reviewing sales numbers, this format analyzes the why behind the performance. It answers critical questions like, "Did our investment in signal intelligence actually improve our leading indicators and revenue?"
Strategic Breakdown
Presenting a case study in a QBR is effective because it creates a blueprint for success that can be scaled. It grounds the strategic conversation in real-world evidence, making it easier to secure buy-in for future investments. The focus shifts from abstract goals to a proven, repeatable model.
For example, the BioServices QBR would highlight how they started by focusing on a single vertical to master their signal tuning. This controlled approach allowed them to demonstrate early wins, such as a measurable decrease in days-to-first-conversation, which they then used as internal proof to drive wider adoption. This makes the strategy feel achievable and data-backed.
Key Insight: A case study-focused QBR turns a strategic initiative into a compelling narrative with clear heroes (early adopters), challenges (initial resistance), and a quantifiable victory (financial impact). This storytelling approach is far more effective for driving change than a simple data dump.
Actionable Takeaways
To structure a QBR around a case study, focus on these elements:
- Isolate and Measure: Start by rolling out the new strategy in one focused segment. Before launch, benchmark leading indicators like signal action rates and sales cycle velocity to create a clear "before and after" picture.
- Invest in Enablement: Appoint a clear owner for signal quality and playbook refinement. Use early adopters as internal champions to advocate for the new process and share their successes.
- Create a Feedback Loop: Solicit direct feedback from the sales team after the first 30-60 days. Use this input to continuously refine signal filters and playbooks, ensuring they remain relevant and valuable.
This is one of the best quarterly business review examples for leadership teams who need to prove the ROI of a major strategic shift.
8. Financial Analysis: Impact of Signal-Driven Sales Efficiency on P&L
This QBR model is for CFOs, CROs, and revenue leaders who need to justify investments in account intelligence. It shifts the conversation from activity metrics to financial outcomes, linking signal-driven sales motions to the company's profit and loss (P&L) statement. This approach quantifies the ROI of tools like Salesmotion by modeling their effect on sales productivity.
Instead of just presenting sales quotas, this financial model dissects the "how." It answers questions like, "How did our investment in account intelligence reduce the cost of acquiring a new dollar of ARR?" or "What is the financial impact of a 10% increase in sales efficiency driven by proactive selling?"
Strategic Breakdown
This template aligns sales strategy with corporate financial goals. It forces a rigorous analysis of the revenue engine, translating operational improvements into measurable financial gains. The model connects account signals to productivity improvements, which in turn affect key P&L line items like sales and marketing expenses.
For instance, a standard QBR might state, "Our team made 500 more calls this quarter." A financially-focused QBR would articulate: "By focusing outreach on accounts showing high engagement signals, our reps increased their productive selling time by 15%. This contributed to a 5% reduction in Customer Acquisition Cost (CAC) and added $250k in pipeline with the same headcount."
Key Insight: Framing the QBR around a P&L impact model turns the sales leader into a strategic business partner to the CFO. It demonstrates a deep understanding of how sales execution directly contributes to profitability, not just top-line growth.
Actionable Takeaways
To build this financial narrative into your QBR, focus on:
- Model Key Efficiency Levers: Identify 2-3 core metrics where account intelligence creates leverage. This could be reduced ramp time for new reps, increased pipeline per rep, or a higher net revenue retention (NRR) rate.
- Connect Signals to Financials: Create a clear, quantifiable link between a customer signal and a financial outcome. For example, show how "expansion signals" led to a shorter expansion sales cycle, directly lowering the cost of sale.
- Run "What-If" Scenarios: Use the model to project future impact. Ask, "If we increase efficiency by another 5%, what will be the effect on our operating margin next quarter?"
This is one of the most compelling quarterly business review examples for leadership teams focused on building a scalable and profitable revenue machine.
Signal-Driven QBR: 8-Item Comparison
| Item | Implementation complexity | Resource requirements | Expected outcomes | Ideal use cases | Key advantages |
|---|---|---|---|---|---|
| Signal-Driven QBR Agenda Template | Medium — requires signal logging and cross-team alignment | CRM hygiene, RevOps owner, periodic reporting templates | Shorter, outcome-focused QBRs; clearer account momentum attribution | Revenue teams using account intelligence for quarterly reviews | Focuses discussion on material signals; aligns RevOps and reps; highlights tooling ROI |
| AI-Generated Executive Summary with Signal Context | Medium — needs clean pipelines and summary automation | Data pipeline, AI/templating tools, executive visuals | One-page C-suite narrative linking signals to revenue and velocity | Board/executive reporting, investor updates, fast decision cycles | Translates technical metrics into business impact; time-saver for execs |
| KPI Dashboard: Signal Quality & Velocity Metrics | High — multiple integrations and continual data governance | Integrations (CRM/Slack/BI), dashboards, analyst oversight | Real-time visibility into signal health, response velocity, and gaps | Ops teams monitoring program performance and scaling intelligence | Surfaces blind spots; supports coaching and investment justification |
| Account Planning Template: Signal-Enriched Strategy Framework | Medium–High — API integration and template design | Signal integrations, vertical templates, RevOps support | Living account plans kept current with triggers and tailored tactical plays | Strategic account management and multi-stakeholder sales cycles | Keeps plans relevant; links signals to initiatives; enables multi-threading |
| Action Plan: From Signal Alert to Closed Deal | Medium — playbook design and workflow automation | Playbook library, Slack/workflow routing, CRM logging, training | Faster activation on signals, consistent outreach, compressed sales cycles | Rapid response to high-impact signals; scaling playbook-driven outreach | Lowers activation friction; creates accountability; reproducible sequences |
| Customer Case Study: Life Sciences Revenue Team - Overview | Low — narrative synthesis of deployment and timeline | Case documentation, anonymized metrics, deployment timeline | Illustrative proof-of-concept and adoption roadmap | Internal buy-in, stakeholder persuasion, pilot planning | Shows timeline to value; contextualizes implementation approach |
| Customer Case Study: BioServices Results & Financial Impact | Low — detailed outcome reporting and metrics compilation | Quantified results, testimonials, financial summaries | Demonstrated ROI, improved forecast accuracy, faster deal velocity | Building business case for investment; CFO/stakeholder sign-off | Concrete ROI and performance improvements; success factors & lessons |
| Financial Analysis: Impact of Signal-Driven Sales Efficiency on P&L | High — scenario modeling and finance collaboration | Finance modeling, scenario data, cross-functional input | Forecasted incremental revenue, cost savings, ROI and payback estimates | CFO evaluation, budget approval, investment case development | Quantifies net impact and payback; supports informed investment decisions |
Transform Your Next QBR from a Report-Out to a Revenue Driver
The quarterly business review examples in this article show a fundamental shift in how successful revenue teams operate. Moving beyond a recap of past performance, these QBRs become forward-looking strategic sessions. They pivot from rearview mirror reporting to a windshield view of the opportunities ahead, driven by real-time account intelligence.
We've seen how a Signal-Driven Agenda sets the stage for a productive conversation and how an AI-Generated Executive Summary surfaces critical insights. These tools don't just save time; they change the nature of the meeting. Instead of spending an hour presenting data, your team can spend that time debating strategy and building a concrete plan to win. The common thread is the move from reactive analysis to proactive engagement.
Key Takeaways for Your Next QBR
To make your next QBR truly impactful, focus on these principles:
- Prioritize Signals Over Static Data: Lagging indicators tell you where you've been. Leading indicators, such as a customer's recent funding round, tell you where you need to go. Build your QBR around these forward-looking signals.
- Connect Insights to Action: Every piece of data must answer the question, "So what?" A KPI Dashboard isn't just about tracking signal volume. It's about understanding which signals lead to the fastest deal cycles and then building a playbook to replicate that success.
- Make Account Planning Dynamic: A plan isn't a document you create once. It’s a living guide that adapts as new intelligence emerges, ensuring your team is always pursuing the most relevant opportunities.
The goal of a modern QBR is to create a repeatable process for success. By dissecting the why behind your wins and losses with granular, signal-based context, you uncover the patterns that lead to predictable revenue. As the case studies showed, this approach has a direct financial impact, improving sales efficiency and strengthening your bottom line.
Your Action Plan for a Better QBR
Putting these concepts into practice doesn't require a complete overhaul. Start small:
- Identify Your Top 3 Signals: Before your next QBR, work with your team to identify the three most powerful buying signals for your business. Is it a leadership change? A new product launch?
- Pilot the Signal-Driven Agenda: Choose one account team to pilot the Signal-Driven QBR Agenda. Task them with building their presentation around these signals and the actions they took in response.
- Measure the Impact: Track the outcomes. Did the conversation feel more strategic? Did it produce a clearer, more actionable plan for the next 90 days?
By implementing even one of these quarterly business review examples, you can transform your QBR from a mandatory meeting into your most valuable strategic asset. It becomes the moment where intelligence, strategy, and execution converge to drive real business growth.
Stop chasing lagging indicators and start building your pipeline with proactive intelligence. The Salesmotion platform automates the discovery of critical account signals, turning market noise into clear, actionable revenue opportunities for your team. See how our signal-driven approach can power your next QBR by visiting Salesmotion.