Looking for the metrics list? Skip to the pipeline metrics that predict revenue, the leading vs. lagging breakdown, or the diagnostic checklist for unhealthy pipelines.
Most advice on sales pipeline metrics starts in the wrong place.
It starts with what is already in the CRM. How many deals. How much value. How much coverage against quota. Those numbers matter, but they are not the whole story, and they are often not even the useful part of the story.
A pipeline can look full and still be fragile. A dashboard can look green while the quarter is already drifting off course. The difference is whether you are measuring static inventory or forward motion.
Good RevOps teams learn this early. Reporting on opportunities is necessary. Predicting revenue requires more. You need to know which metrics describe the current state, which metrics expose momentum, and which signals tell you whether future pipeline will exist at all.
Why Your Sales Pipeline Metrics Are Lying to You
The most popular pipeline advice says a full pipeline is a healthy pipeline. That is wrong often enough to be dangerous.
DemandDrive puts it plainly: “If you're only tracking sales pipeline KPIs at the opportunity level, you're managing too late.” It also notes that conventional metrics are often lagging indicators, and that coverage ratios can be inflated by “zombie deals,” masking a looming crisis (DemandDrive).

Full is not the same as healthy
A pipeline report usually answers inventory questions.
- How many open opportunities exist
- What total value they represent
- How those deals map to stages
- Whether coverage appears sufficient
Those are useful management views. They are not predictive by themselves.
A healthy pipeline has movement, recent buyer engagement, believable close dates, and qualification that survives scrutiny. A full pipeline can be padded with stale deals, optimistic timing, and opportunities that entered the system without a reason to buy now.
That is where teams get trapped. They trust the dashboard because the dashboard is tidy.
Key takeaway: Pipeline metrics become misleading when leadership uses static volume as a substitute for deal quality, buying intent, and timing realism.
The pre-pipeline gap is where many teams lose the quarter
The biggest blind spot sits upstream from the CRM.
Before an opportunity exists, something has to happen. A company hires a new executive. Funding lands. A strategic initiative shows up in an earnings call. A new office opens. A competitor gets mentioned. A team starts hiring around a problem your product solves.
Those changes create conditions for pipeline creation. Yet most sales organizations do not measure how quickly they detect those triggers, whether reps act on them fast enough, or which signals convert into qualified meetings and opportunities.
That is the pre-pipeline intelligence gap. It matters because by the time classic pipeline metrics turn red, the damage is already in motion.
Clean CRM data still matters. If your records are messy, every downstream metric gets distorted. Strong CRM hygiene practices are not administrative overhead. They are the baseline for any forecasting system you want to trust.
What changes when you adopt this lens
You stop asking only, “Do we have enough pipeline?”
You start asking better questions:
- Which account signals are creating new opportunities
- How fast reps act on those signals
- Which deals are moving because buyers are progressing, not because stages got updated
- Where false confidence is hiding
That shift sounds subtle. In practice, it changes how managers inspect deals, how SDR teams get measured, and how revenue leaders decide whether a quarter is recoverable.
See Salesmotion in action
Take a self-guided interactive tour — no signup required.
The Foundational Sales Pipeline Metrics You Must Track
Before you get fancy, get the basics right.
The strongest forecasting teams are not allergic to foundational metrics. They are disciplined about them. According to Forbes, sales teams with accurate sales pipelines are 10% more likely to grow revenue year over year (Salesgenie citing Forbes). That is the practical case for precision. Bad definitions and loose data entry do not just create ugly reports. They distort revenue planning.
The four metrics that matter first
Most sales pipeline metrics roll up from four inputs:
- Number of opportunities
- Average deal size
- Win rate
- Sales cycle length
If one of these is wrong, every composite metric built on top of it becomes less useful.
Here is the simplest working reference.
| Metric | Formula | What It Measures | Typical B2B Benchmark |
|---|---|---|---|
| Number of Opportunities | Count of open deals in a period or pipeline view | Pipeline volume and top-of-funnel sufficiency | No universal benchmark |
| Average Deal Size | Total closed-won value ÷ number of closed-won deals | Revenue value per successful deal | No universal benchmark |
| Win Rate | (Closed Won Deals ÷ Total Opportunities) x 100 | How effectively opportunities convert to wins | 20% to 25% |
| Sales Cycle Length | Average time from opportunity creation to close | How long revenue takes to convert | 3 to 6 months in B2B |
What each metric tells you in practice
Number of opportunities
This is the bluntest metric and still one of the most useful.
If opportunity count is low, the rest of the funnel has no room to work. But a large number alone can create false confidence, especially if qualification is weak. I treat this as a capacity metric, not a quality metric.
A common mistake is celebrating opportunity volume without checking whether those deals are recent, active, and tied to a buyer initiative.
Average deal size
Average deal size reveals what kind of business your team is winning.
If the number rises, that can be good. It can also mean reps are over-concentrating on a small set of large deals while mid-market volume dries up. If it falls, the team may be discounting, selling smaller packages, or drifting into weaker-fit accounts.
This metric needs context from segmentation. A healthy change in SMB is not interpreted the same way as a healthy change in enterprise.
Win rate
Win rate sounds straightforward. It is not.
A low win rate often means poor qualification, bad stage discipline, weak discovery, or an ICP problem. A high win rate can look excellent while hiding another issue: your team may be qualifying too hard and not creating enough pipeline.
For broad context, the benchmark range commonly used in B2B is 20% to 25% from the verified data above. That range is not a target by itself. It is a prompt to inspect how selective and how effective your process really is.
Sales cycle length
This metric exposes friction faster than most leaders realize.
When cycles stretch, cash moves later, forecasting gets shakier, and rep capacity drops because deals occupy the pipe longer. In many B2B motions, average cycle length sits in the 3 to 6 month range based on the verified data. The point is not whether you are exactly inside that window. The point is whether your own cycle is stable, explainable, and improving for the right reasons.
Practical rule: If a core metric changes, do not ask first whether it is good or bad. Ask what operational behavior changed underneath it.
Foundational metrics only matter if definitions are tight
Teams often argue about performance when the problem is inconsistent measurement.
A rep calls something an opportunity after a first meeting. Another waits until budget is confirmed. A manager marks a deal as active because there was an email reply. Another requires a scheduled next step. That inconsistency wrecks trust.
If you want a practical walkthrough on process design, this guide on how to build an effective sales pipeline is useful because it ties stage structure back to operating discipline.
For a narrower view of one key ratio, this breakdown of pipeline coverage helps clarify why quota math only works when opportunity definitions are strict.

“There's been a big focus on hyper personalization and relevance in our outbounding efforts. Salesmotion has been a key partner in hitting our significantly increased meeting targets. What stands out is how simple it is. Reps can log in and get valuable account insights within 30 seconds to a minute.”
Joe DeFrance
VP of Sales, Incredible Health
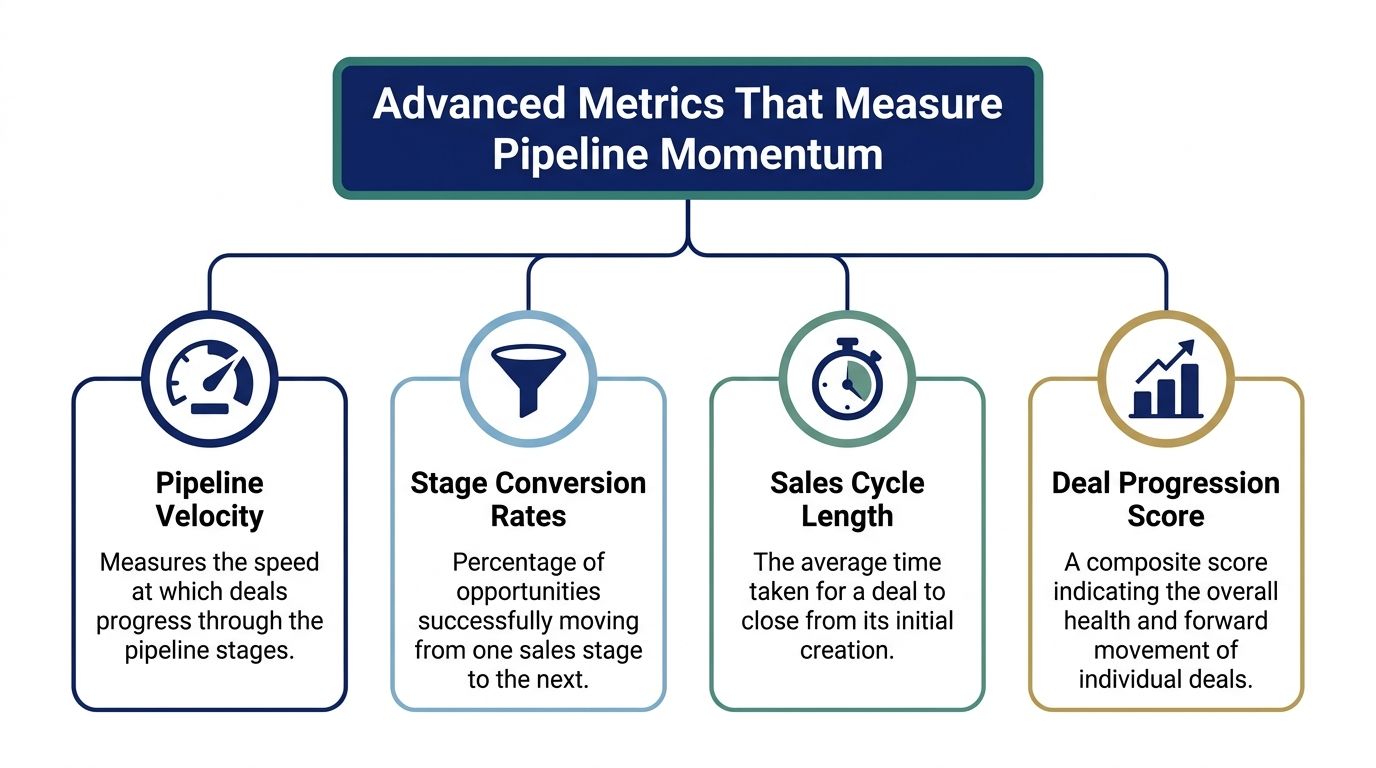
Advanced Metrics That Measure Pipeline Momentum
Once the core inputs are reliable, the next job is to measure motion.
Static pipeline value tells you what exists. Momentum metrics tell you whether revenue is moving toward a close. That distinction matters more than most dashboards admit.
Pipeline velocity is the clearest composite metric
Pipeline velocity combines deal count, win rate, average deal size, and sales cycle length into one operational number.
The formula is:
(Number of Deals x Win Rate x Average Deal Size) ÷ Sales Cycle Length
Forecastio gives a concrete example: with 100 deals, a 22% win rate, a $50,000 average deal size, and a 90-day cycle, pipeline velocity is approximately $12,222 per day (Forecastio).
That is why velocity is more than a formula. It acts like a speedometer for your revenue engine. It forces one honest question: how quickly is this pipeline capable of turning into revenue under current conditions?
A large pipeline with weak velocity is not healthy. It is congested.
What makes velocity useful
Velocity matters because it compresses several management conversations into one number.
If velocity drops, you do not need to guess wildly. Something underneath changed:
- Fewer deals entered the pipeline
- Win rate weakened
- Average deal size shrank
- Sales cycle length stretched
That makes velocity a practical leadership metric, not just an analytical one. It points you toward the bottleneck instead of merely confirming that a shortfall exists.
If you want a deeper operational breakdown, this guide to pipeline velocity is worth reading alongside your own CRM reports.
Coverage is useful, but only with pressure applied
Pipeline coverage still matters. It just gets over-trusted.
From the verified data, coverage is typically calculated as total pipeline value divided by quota, with teams often targeting 3x to 4x quota to account for attrition. As a directional metric, that is fine. As a standalone health signal, it is weak.
Coverage tells you whether there is enough apparent opportunity volume relative to the target. It does not tell you whether that volume is active, winnable, recent, or correctly timed.
Use coverage to frame the conversation. Do not use it to end the conversation.
Stage conversion rates expose where deals die
Velocity is the big picture. Stage conversion rates show where the picture breaks.
These rates are calculated stage by stage. Deals advancing divided by deals in the current stage. That simple measure reveals whether the issue sits in qualification, demo quality, proposal quality, stakeholder alignment, pricing, or negotiation.
The verified data includes directional stage examples such as 40% to 50% from discovery to demo and 20% to 30% at negotiation. Those are not universal standards. They are useful reminders that every stage behaves differently and should be reviewed differently.
A few practical patterns matter:
| Pattern | What it usually means | What to inspect |
|---|---|---|
| Strong early conversion, weak late conversion | Deals are entering too easily or value is not compelling later | Qualification criteria, stakeholder mapping, pricing pressure |
| Weak early conversion, stronger late conversion | Top-of-funnel quality is poor but reps close well once fit exists | Lead sources, prospecting quality, messaging |
| Flat conversion across stages | Stage definitions may be vague or teams are advancing deals inconsistently | Exit criteria, manager inspection, CRM discipline |
Tip: Every stage should answer a different buyer question. If two stages behave the same way, your pipeline design may be cosmetic.
How to Interpret and Act on Your Pipeline Data
Teams do not fail because they lack numbers. They fail because they react to numbers too late or in the wrong way.
The value of sales pipeline metrics appears when you can diagnose a pattern and assign an action. Metrics are not interesting on their own. They are useful only when they change rep behavior, manager coaching, or forecast assumptions.
Reevo makes the diagnostic value of velocity clear. When pipeline velocity declines, it shows whether the problem is fewer deals, smaller deals, lower conversion, or longer cycles. Its example of 20 deals at $5,000 each, a 25% win rate, and a 30-day sales cycle equaling $833 per day shows how one metric can point directly to the failing lever (Reevo).
Four common pipeline scenarios
High coverage and low velocity
This is the classic “strong on paper” pipeline.
Diagnosis: you have enough nominal pipeline, but deals are not progressing fast enough to support the forecast. Usually that means stage congestion, stale opportunities, or over-optimistic close dates.
Action:
- Tighten exit criteria for stages
- Remove inactive deals from commit views
- Force next-step evidence in pipeline reviews
- Re-forecast based on realistic cycle timing, not rep optimism
High win rate and low opportunity count
This one fools leadership because the close rate looks healthy.
Diagnosis: the team closes well when they get into the right accounts, but they are underfed. The issue is usually prospecting capacity, weak inbound conversion, or too few timely reasons to engage.
Action:
- Review account coverage and SDR activity quality
- Inspect whether reps are only working obvious accounts
- Push earlier outreach around account changes, not just late-stage hand-raisers
Large average deal size and unstable forecasts
A few large deals can make a pipeline look impressive.
Diagnosis: concentration risk. Your quarter depends on a small number of transactions, each with complicated buying dynamics and greater timing uncertainty.
Action:
- Build a separate inspection cadence for strategic deals
- Require stronger multi-threading and stakeholder validation
- Balance the portfolio with more mid-sized opportunities where possible
Flat opportunity volume and falling conversion
Diagnosis: your top-of-funnel may look steady, but quality is eroding. That often points to poor messaging, loose qualification, or marketing-sales misalignment.
Action:
- Audit call notes and discovery quality
- Check whether the ICP drifted
- Compare conversion by source, segment, and rep behavior
Use metrics to coach, not just judge
Good managers do not walk into forecast calls and ask, “Why is this number down?”
They ask narrower questions:
- Which stage changed first?
- Which team segment changed first?
- Which source or account type changed first?
- What buyer evidence is missing?
That is how numbers become operational.
If you want a practical companion for manager workflows, these actionable sales pipeline management tips are useful because they focus on review discipline, not just reporting.
Forecast calls also improve when the interpretation loop is connected back to assumptions. Stronger forecast accuracy work matters here. The point is not to make the dashboard prettier. The point is to change what the business believes about likely revenue.
Manager habit to keep: For every red metric, name the operational cause you believe is driving it before you prescribe a fix.

“This is my singular place that very simply summarizes a company's top initiatives, strategies and connects them to my solution. Something I would spend hours researching manually, now it's automated.”
Derek Rosen
Director, Strategic Accounts, Guild Education
The Hidden Risks That Inflate Your Pipeline
A bloated pipeline is worse than a small one.
A small pipeline creates urgency. An inflated pipeline creates denial. Teams keep working bad deals, leadership trusts numbers that should be discounted, and forecast misses arrive as if they were a surprise.
Zombie deals are not harmless clutter
Every CRM accumulates them.
The opportunity has a future close date. The account still fits the ICP on paper. Someone had a decent conversation at some point. But there is no confirmed next step, no active buying process, and no recent proof that the initiative still matters.
These deals stay alive because no one wants to kill them. Reps want optionality. Managers want coverage. Leaders want to believe there is still enough in the quarter.
The cost is real:
- They inflate coverage
- They consume manager attention
- They corrupt stage conversion analysis
- They make rep workload look healthier than it is
Slippage is not a timing issue
Too many teams treat slippage like a scheduling inconvenience.
Forecastio’s framing is much sharper: deal slippage usually signals deeper pipeline problems. When deals constantly move from one period to another, it often means qualification is weak or close dates were based on optimism. A rising slippage rate means the pipeline looks stronger on paper than it really is (Forecastio).
That should change how you inspect pushouts.
Do not ask only, “When will this close now?” Ask:
- What buyer event was supposed to happen and did not?
- Which stakeholder never got engaged?
- Was the initiative real, or just interest?
- Did the rep confuse activity with progress?
Qualification problems often hide inside neat-looking dashboards
The most dangerous pipelines are not messy. They are tidy and wrong.
A well-organized CRM with stage dates, forecast categories, and large values can still reflect poor qualification if the underlying deal logic is weak. Common signs include repeated date changes, vague mutual action plans, and deals that “feel good” but lack hard buyer commitments.
Use slippage and inactivity as diagnostic inputs, not just cleanup triggers.
A few operating rules help:
- Treat repeated pushouts as a qualification event: Do not just move the date. Reassess deal status.
- Require evidence for stage progression: Notes should show what the buyer did, not only what the rep did.
- Separate active pipeline from reportable inventory: Not every open deal belongs in the same forecasting conversation.
- Inspect old deals aggressively: Age alone does not disqualify an opportunity, but age without momentum should.
Key takeaway: Pipeline inflation usually starts as a qualification problem and ends as a forecasting problem.
From Lagging Metrics to Leading Indicators with Account Intelligence
If lagging metrics tell you what happened, leading indicators tell you what is forming.
That is the shift revenue teams need. Not more dashboards. Better upstream visibility.
What leading indicators look like
Many teams already know how to inspect opportunities. Fewer know how to monitor the conditions that create opportunities.
Leading indicators often come from account changes, not CRM status changes. Examples include executive hires, funding announcements, new job postings, product launches, strategic partnerships, investor pressure, public comments from leadership, and visible shifts in org design.
Those events matter because they give reps a credible “why now.” They also improve timing. Outreach tied to a trigger is easier to prioritize, easier to personalize, and easier to move into a qualified conversation than generic sequence volume.
This changes pipeline management upstream
A useful leading-indicator model asks a different set of questions:
| Leading indicator | What it helps you improve | Why it matters |
|---|---|---|
| Account trigger detected | Opportunity creation | Reps act when buyer context changes |
| Trigger-to-outreach speed | Sales cycle quality | Fast action preserves relevance |
| Trigger-to-meeting conversion | Messaging quality | Shows whether the signal was usable |
| Meeting-to-opportunity conversion | Qualification quality | Shows whether upstream targeting is working |
| Active signal on open deal | Deal progression | Gives reps context to re-engage or de-risk |
Account intelligence platforms can be operationally useful here. For example, Salesmotion monitors target accounts for signals like funding, hiring, investor updates, executive moves, LinkedIn activity, interviews, and press releases, then sends context and next-step guidance into Slack, email, or CRM. Used properly, that kind of workflow helps teams measure not just pipeline inventory but also the signal flow that feeds it.
Better account context improves existing metrics too
Leading indicators do not replace classic sales pipeline metrics. They make them more meaningful.
- Opportunity count improves because reps engage accounts when change creates urgency.
- Sales cycle length improves when outreach starts with buyer context instead of cold assumptions.
- Win rate improves when teams understand initiative, stakeholders, and timing earlier.
- Slippage decreases when reps spot account changes that either accelerate action or reveal hidden risk.
The practical benefit is not theoretical. Managers can inspect whether a deal has fresh account intelligence behind it. SDR leaders can see whether trigger-based outreach creates better meetings. RevOps can compare pipeline created from signal-based motion versus generic outbound lists.
That is a better system because it measures the conditions behind future revenue, not only the artifacts left behind after a deal is already opened.
Example Dashboards for SaaS and Manufacturing
A useful dashboard reflects the sales motion. Not every business should stare at the same widgets.
SaaS dashboard
In a high-volume SaaS motion, speed and conversion deserve the most attention.
A practical dashboard would emphasize:
- lead-to-opportunity conversion
- number of new opportunities created
- pipeline velocity
- win rate by segment
- sales cycle length by source
- stage conversion in early and middle stages
The reason is simple. In SaaS, a lot of value comes from keeping opportunity creation and progression healthy at volume. A dashboard that over-focuses on total pipeline value can hide deteriorating quality quickly.
A sales leader here usually wants to know whether the team is generating enough qualified opportunities and moving them through the middle of the funnel without friction.
Manufacturing dashboard
In manufacturing or another long-cycle, high-touch motion, the dashboard should look different.
I would emphasize:
- average deal size
- stage conversion on late-stage opportunities
- deal aging by stage
- slippage on strategic deals
- forecast view by named account
- concentration risk across large opportunities
This kind of business often has fewer deals, more stakeholders, more procurement friction, and longer decision windows. Velocity still matters, but the practical management work usually sits in qualification depth, stakeholder alignment, and timing risk on large deals.
Same metric family, different emphasis
Both teams need sales pipeline metrics. They just need different priority.
SaaS leaders usually inspect flow. Manufacturing leaders usually inspect deal quality and timing credibility. If your dashboard treats those motions as identical, your reporting is decorative.
Building Your Predictive Revenue Engine
A modern revenue engine is not built by staring harder at opportunity reports.
It is built by combining three layers of visibility. First, the foundational metrics that keep definitions clean. Second, the momentum metrics that reveal whether pipeline is moving. Third, the upstream signals that explain whether future pipeline is being created at the right time and from the right accounts.
That is the practical shift from lagging measurement to predictive management.
If you only measure what is already in the CRM, you are inspecting history with a short delay. If you measure account changes, signal response, opportunity quality, progression, and slippage together, you get a much more honest view of where revenue is heading.
The best sales pipeline metrics do not just count deals. They help leaders decide where to intervene, what to challenge, and which assumptions to stop trusting.
Frequently Asked Questions About Sales Pipeline Metrics
How often should sales pipeline metrics be reviewed
Review cadence should match the job.
Reps need daily visibility into priorities and next steps. Frontline managers need a weekly inspection rhythm. Revenue leaders usually need a weekly operational view and a broader trend view over time.
The mistake is reviewing everything at the same altitude. Opportunity hygiene, stage movement, forecast risk, and upstream signal quality should not all live in one meeting.
Which sales pipeline metrics matter most for forecasting
For forecasting, I care most about a combination of opportunity quality, sales cycle realism, stage conversion patterns, velocity, and slippage.
Raw pipeline value matters less than teams think. A large number with weak progression and repeated date changes is not forecast strength. It is deferred disappointment.
How do you align sales and marketing around pipeline metrics
Use shared definitions first.
If marketing measures success by lead volume while sales measures success by late-stage pipeline, both teams will protect their own numbers. Alignment gets easier when both teams review the same funnel handoffs, especially lead-to-opportunity conversion and opportunity quality by source.
Also agree on disqualification reasons. They often tell you more than campaign volume.
Should SDR compensation be tied to pipeline quality or quantity
Quality should have real weight.
If compensation rewards only meeting count or raw opportunity volume, SDR teams will optimize for calendar density. That usually creates weak qualification and inflated pipeline. A better model includes quality checks such as attendance, accepted opportunity criteria, and progression after handoff.
You want SDR incentives to support revenue creation, not just CRM creation.
What is the best way to spot pipeline inflation early
Look for repeated close-date changes, stale stage duration, missing next steps, and deals with no current buyer event behind them.
Also compare what reps say in forecast calls with what the account has done. Buyer action is stronger evidence than rep confidence.
What is one mistake RevOps teams make with sales pipeline metrics
They over-index on dashboard completeness.
A perfect dashboard that nobody uses in deal inspection is a reporting project, not an operating system. Useful metrics should change decisions. If a metric never changes coaching, qualification, prioritization, or forecasting, remove it or demote it.
If your team wants to move from lagging pipeline reports to signal-driven revenue execution, Salesmotion is built for that workflow. It helps sales teams monitor account changes, turn those signals into actionable context, and connect upstream intelligence to better pipeline creation, prioritization, and progression.