A clinical trial consultant who advises biotech sponsors on outsourcing strategy told us something that stopped the conversation: "ClinicalTrials.gov has good coverage, but by the time something is listed, if you're trying to sell, it might be too late." She was not being dramatic. Under federal law, sponsors register interventional studies within 21 days of enrolling the first participant. But by that point, CRO partners have been selected, site networks have been contracted, and vendor budgets have been allocated. The trial showing up in the database is not the beginning of the sales cycle. It is the end.
The teams winning life sciences deals in 2026 are not watching trial registrations. They are watching hiring surges in clinical operations, earnings call language about pipeline acceleration, and Series B funding rounds in therapeutic areas where their solutions fit. Those signals fire 3 to 9 months before ClinicalTrials.gov catches up.
TL;DR: ClinicalTrials.gov is a lagging indicator for B2B sales teams. Hiring patterns, earnings call commentary, patent filings, and funding signals predict pharma buying behavior months before trials are registered. This post maps the leading indicator playbook for life sciences sales, with real examples from CROs and diagnostics companies, and shows where existing intelligence tools fall short.
The Life Sciences Sales Intelligence Landscape Has Gaps
Life sciences sales teams have more data sources than almost any other vertical. The problem is not access. The problem is timing and fragmentation.
ClinicalTrials.gov is the default starting point. It is free, comprehensive, and covers over 500,000 registered studies globally. But as a sales intelligence source, it has the timing problem described above. You see the trial after the buying decisions have been made.
Zymewire is the go-to for pharma-specific intelligence. It tracks clinical trials, funding events, and pipeline changes for biotech companies, and it is popular with CRO sales teams. But the pricing reflects the specialization. Enterprise plans run $25,000 to $60,000+ per year, and the platform focuses narrowly on clinical and funding signals without covering the broader set of indicators, like earnings call language, executive hiring patterns, or patent filings, that predict buying behavior before trial activity begins. For teams evaluating options, our Zymewire alternatives comparison breaks down the tradeoffs.
Citeline (Evaluate Pharma) and PitchBook offer deep coverage of M&A activity, licensing deals, and financial data. Both are valuable for strategy and corporate development teams. But they are designed for analysts, not for sales reps who need actionable account intelligence on a Tuesday morning before a call. Citeline's strength is pipeline valuation and competitive landscape analysis. PitchBook's strength is financial and investor data. Neither connects signals to sales workflows.
The result: most life sciences sales teams are running 4 to 6 fragmented tools. A global diagnostics company we work with targets accounts based on development stage, funding round, and therapeutic area. Their team uses territory-based alerts on clinical trial announcements, funding events, and company news. Before consolidating, they were toggling across five separate platforms to build a single account brief. That is not an efficiency problem. It is a speed-to-market problem.
The Leading Indicator Playbook
If ClinicalTrials.gov is a lagging indicator, what are the leading ones? The signals below consistently fire 3 to 9 months before a trial registration or major purchasing decision, based on patterns we see across life sciences accounts.
Hiring Signals: The Most Reliable Early Indicator
Hiring is the single strongest predictor of what a pharma or biotech company will do next. Every clinical trial phase requires distinct staffing, and the job titles tell you exactly where a company is in its pipeline development.
Phase I preparation: Pharmacology, toxicology, and early clinical development roles. A biotech posting for a Director of Translational Medicine and two Senior Pharmacologists in a specific therapeutic area is telling you where their lead compound is headed.
Phase II to Phase III transition: This is the signal that matters most for CRO sales teams. When a company starts posting for Clinical Research Associates, Senior Biostatisticians, a Director of Regulatory Affairs, and a VP of Medical Affairs simultaneously, they are staffing for a registrational study. That hiring cluster, especially when the roles reference the same therapeutic area, typically precedes ClinicalTrials.gov registration by 4 to 6 months.
Commercial readiness: VP of Commercial Operations, Medical Science Liaisons, market access roles. These hires signal that a company expects regulatory approval and is building the commercial infrastructure to launch. For teams selling analytics platforms, CRM systems, or commercial enablement tools, this is the trigger.
According to IntuitionLabs research on the biopharma job market, regulatory hiring tracks directly with the product pipeline, and pharmacovigilance hires spike as compounds advance through clinical phases. The correlation is strong enough that hiring data alone can approximate a company's clinical timeline.
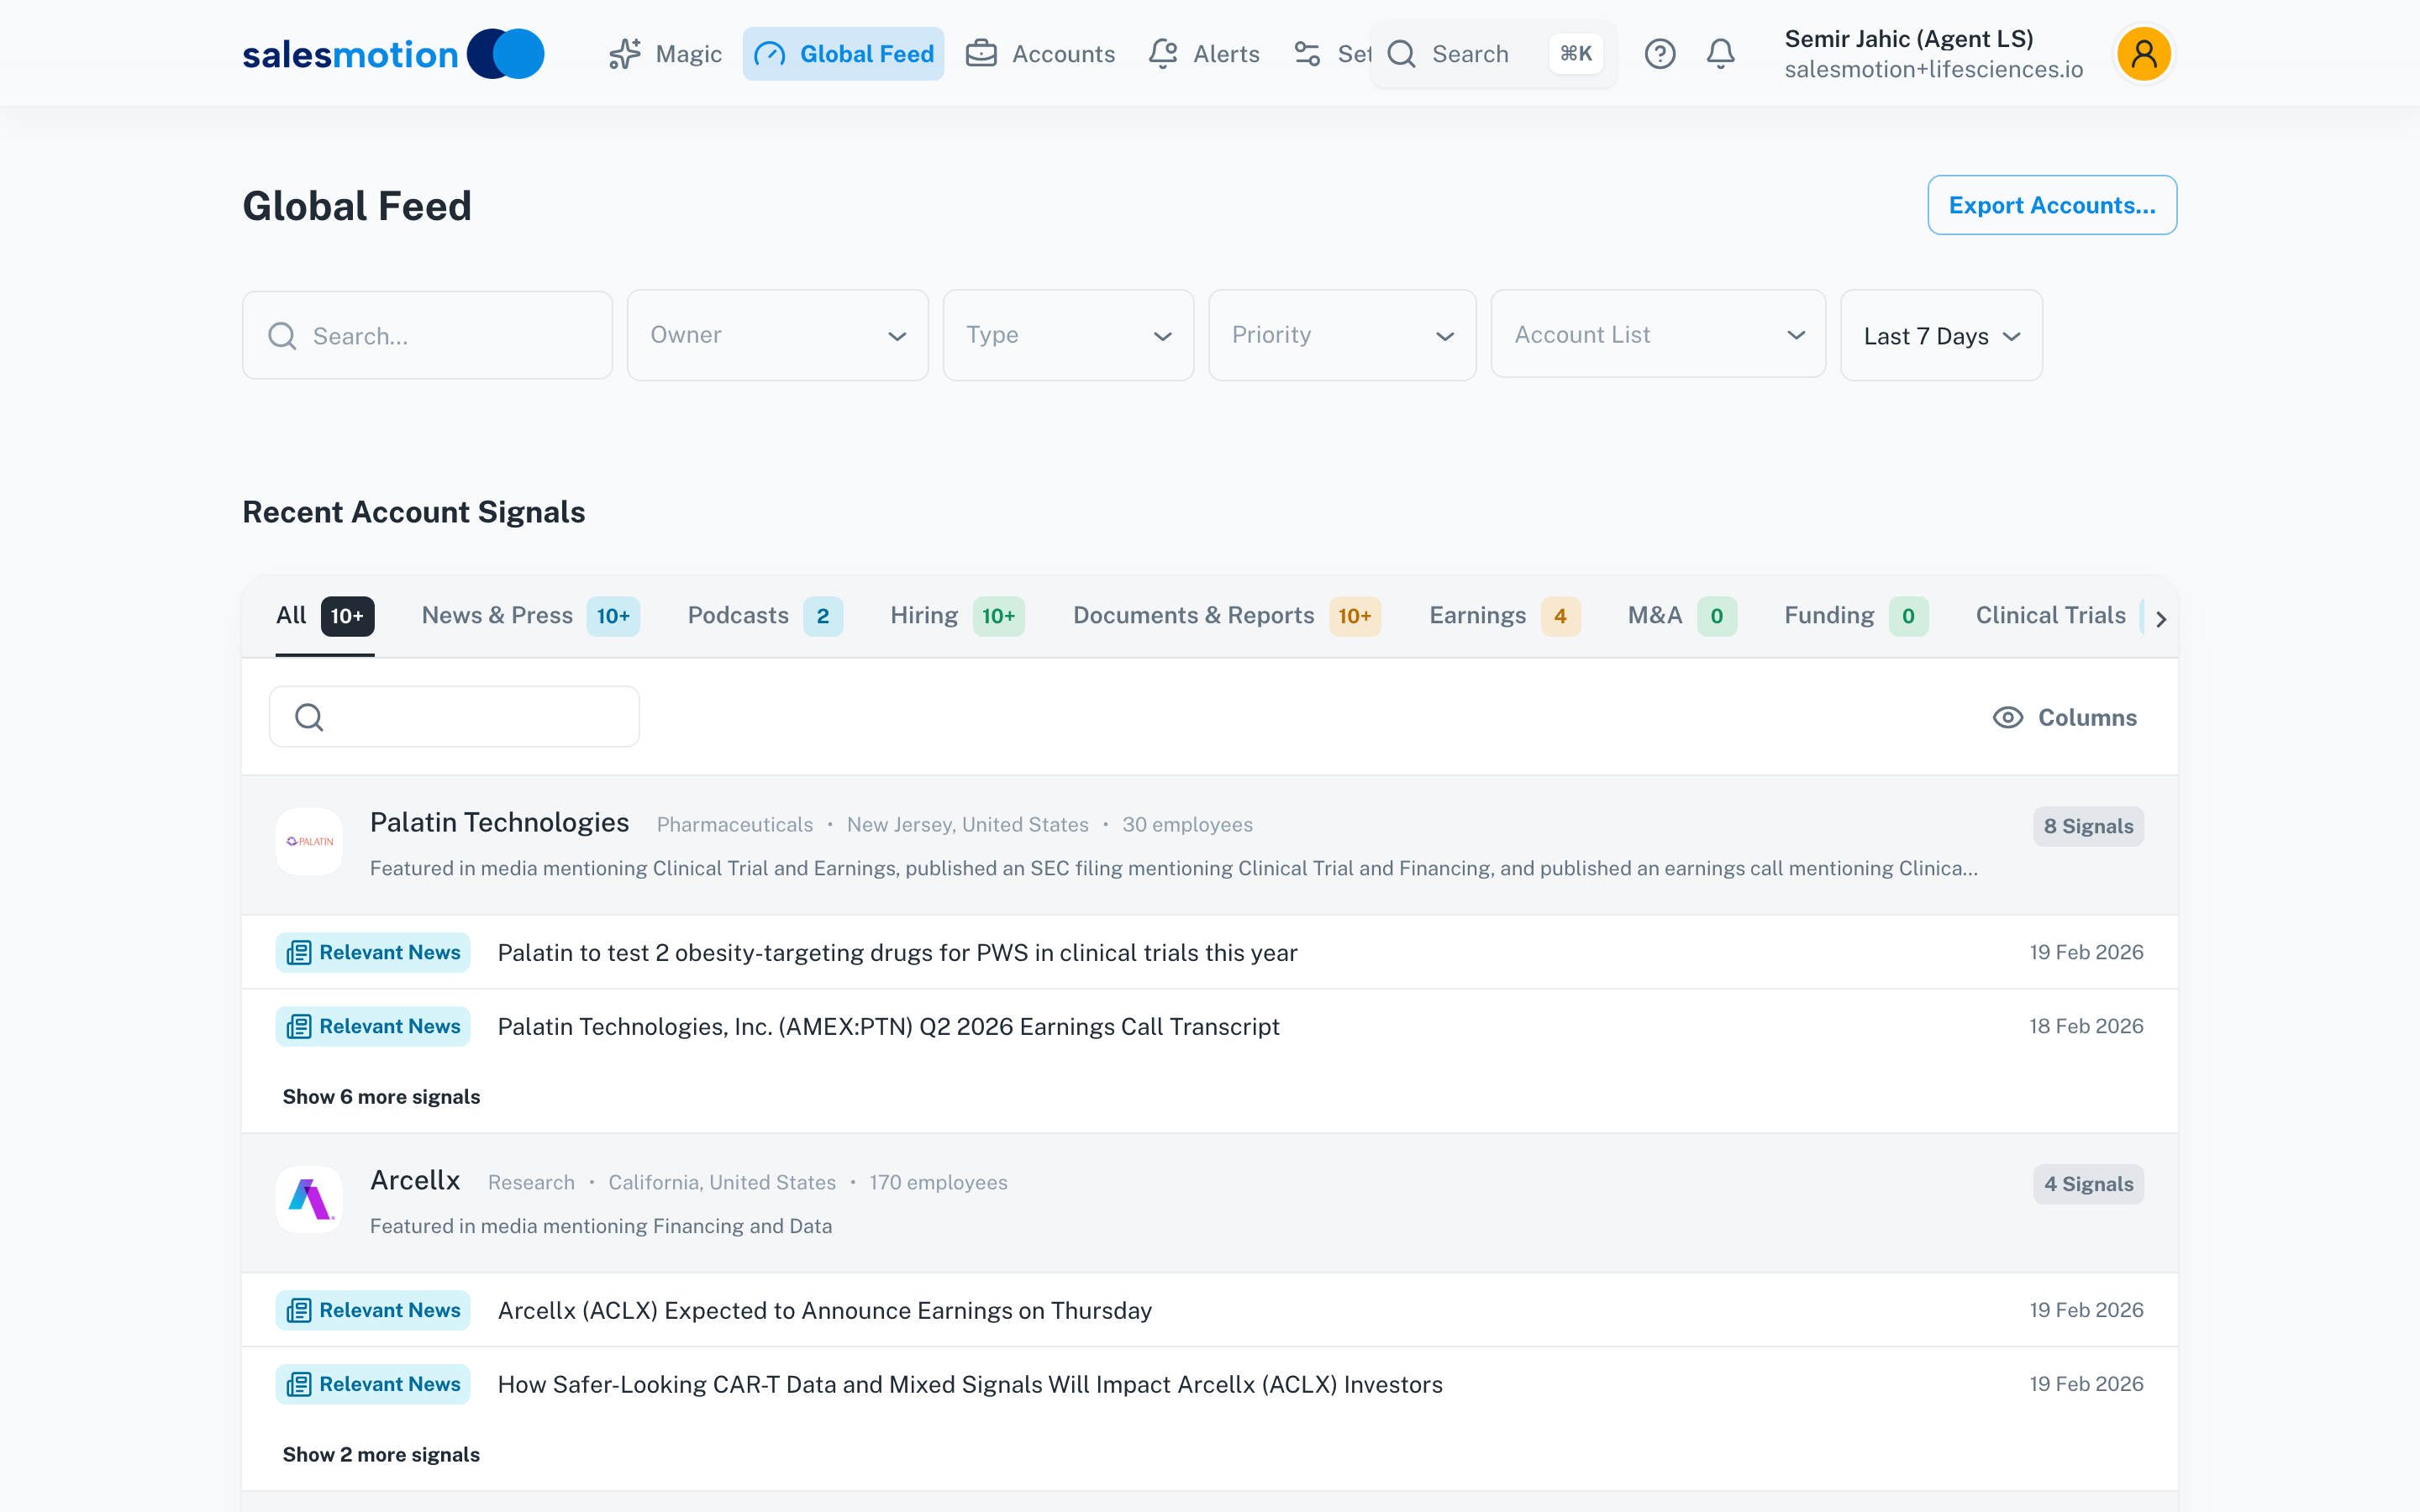 A filtered signal feed tracking hiring, clinical, and funding activity across a life sciences territory.
Earnings Call Keywords: What the C-Suite Tells Wall Street
Public company earnings calls are an underused gold mine for B2B sales intelligence. When a CEO tells analysts "we are advancing our lead oncology asset toward registrational studies" or "we expect to consolidate our vendor landscape in 2026," that is not speculation. That is a statement to shareholders with legal weight.
Keywords that signal near-term buying activity:
- "Pipeline acceleration" or "registrational": Increased spending on clinical operations, CRO partnerships, and trial technology
- "Phase II data readout" with positive framing: Phase III planning is underway, meaning expanded budgets for CROs, sites, and clinical technology
- "Operational efficiency" or "vendor consolidation": Incumbent vendors are at risk, procurement cycles are opening, and analytics and automation tools are being evaluated
- "Commercial infrastructure" or "pre-launch": The company is building its sales and market access capabilities, which means software purchases, hiring, and agency partnerships
A top-5 CRO with 170+ users on their intelligence platform found that even with significant investment in sales tools, only 10 to 15% of reps were logging in daily. One reason: the signals felt "too broad, not specific enough" for the pharma-focused conversations their team was having. Earnings call monitoring was one of the gaps. Generic news alerts about a company do not help a CRO rep prepare for a conversation about a specific therapeutic area pipeline. Earnings call commentary, cross-referenced with hiring and clinical data, does.
Funding Signals: Series B+ in Biotech Means Clinical Investment Is Coming
In biotech, the funding round tells you the development stage. Seed and Series A capital funds discovery and preclinical work. Series B and beyond fund clinical trials.
When a biotech company closes a $150M Series B with the round led by a healthcare-focused fund, a clinical trial is almost certainly the plan. The company will need CRO partnerships, clinical technology platforms, regulatory consulting, and operational infrastructure within 6 to 12 months.
Biotech dealmaking is recovering in 2026 after a challenging period. More acquisitions, licensing deals, and partnerships are being announced as large pharma companies review pipelines against approaching patent expirations. According to Ropes & Gray analysis, 193 M&A transactions totaling $220 billion occurred in the pharma space in 2025. Each of those transactions creates integration challenges, new vendor evaluations, and technology purchasing decisions downstream.
For sales teams, the funding announcement is not the signal itself. The signal is the funding amount, the investor profile, and the therapeutic focus, cross-referenced against the company's pipeline stage. A $50M Series A in a rare disease biotech with no clinical candidates yet is early. A $200M Series C in an oncology company with Phase II data is imminent.
Patent Cliff Timelines: The Macro Signal That Drives Everything
The pharmaceutical patent cliff is the single largest macro driver of B2B buying behavior in life sciences right now. Large pharma companies are staring at hundreds of billions in revenue losing patent protection between 2025 and 2030. Companies respond predictably: they acquire pipeline assets (driving M&A), increase R&D spending (driving CRO outsourcing and clinical technology purchases), and optimize operations to protect margins (driving analytics, automation, and vendor consolidation). Every response creates buying opportunities for B2B sellers who understand the timeline.
CRO deal value retrenched roughly 70% in 2025 compared to 2024, but underlying demand for outsourced clinical services continues to grow. The market is projected to reach $125 billion by 2030, growing at 8.3% annually. The competitive dynamics within that growing market are what create urgency for signal-based selling.
For a deeper dive on how this plays out for contract research organizations specifically, see our analysis on how AI is reshaping CRO business development.

“Salesmotion is helping Cytel elevate our enterprise sales performance by embedding account intelligence directly into our workflow. The platform gives our commercial team real-time visibility into key account movements.”
Jonathan Burr
Chief Commercial Officer, Cytel
What Life Sciences Teams Are Actually Doing (and Struggling With)
Theory is helpful. What is happening in practice tells a different story.
The Fragmentation Problem
A global diagnostics company selling into pharma and biotech targets accounts based on development stage, funding round, and therapeutic area. Their sales team runs territory-based alerts on clinical trial announcements, funding events, and company news. The challenge: they are stitching together intelligence from five separate tools, and none of those tools connect signals to each other.
A clinical trial registration in oncology is more meaningful when you also know the company just hired a VP of Clinical Operations, closed a Series C, and mentioned "accelerating our oncology pipeline" on their last earnings call. Each signal alone is interesting. The combination is a buying signal. But connecting those dots across five platforms is manual work that most reps do not have time to do.
The Adoption Problem
A top-5 CRO deployed a sales intelligence platform to 170+ users. Despite the investment, daily usage hovered at 10 to 15%. The feedback: signals were "too broad, not specific enough" for the pharma-focused conversations reps were having. CRO sales reps do not need to know that a company was mentioned in the news. They need to know that a company's Phase II data readout in immunology was positive, that the sponsor is evaluating CRO partners for the Phase III expansion, and that two competitor CROs have already been in conversations.
This specificity gap is why pharma-specific tools like Zymewire have carved out a strong niche. But even specialized tools have blind spots when they do not connect clinical signals to hiring, earnings, and funding data. The richest account picture comes from layering multiple signal types, not from deeper coverage of a single type.
The CRM Problem
A life sciences executive recruiter shared an observation that surprised us: in all the life sciences companies they work with, only one has a properly organized CRM. Companies with $60M+ in revenue and healthy margins are running broken CRM systems where contact data decays at 2.1% per month, and account intelligence is trapped in individual reps' heads rather than centralized in a system. Signals are only valuable if you can act on them quickly, and when the contact data lives in a spreadsheet someone updated six months ago, the signal goes to waste.
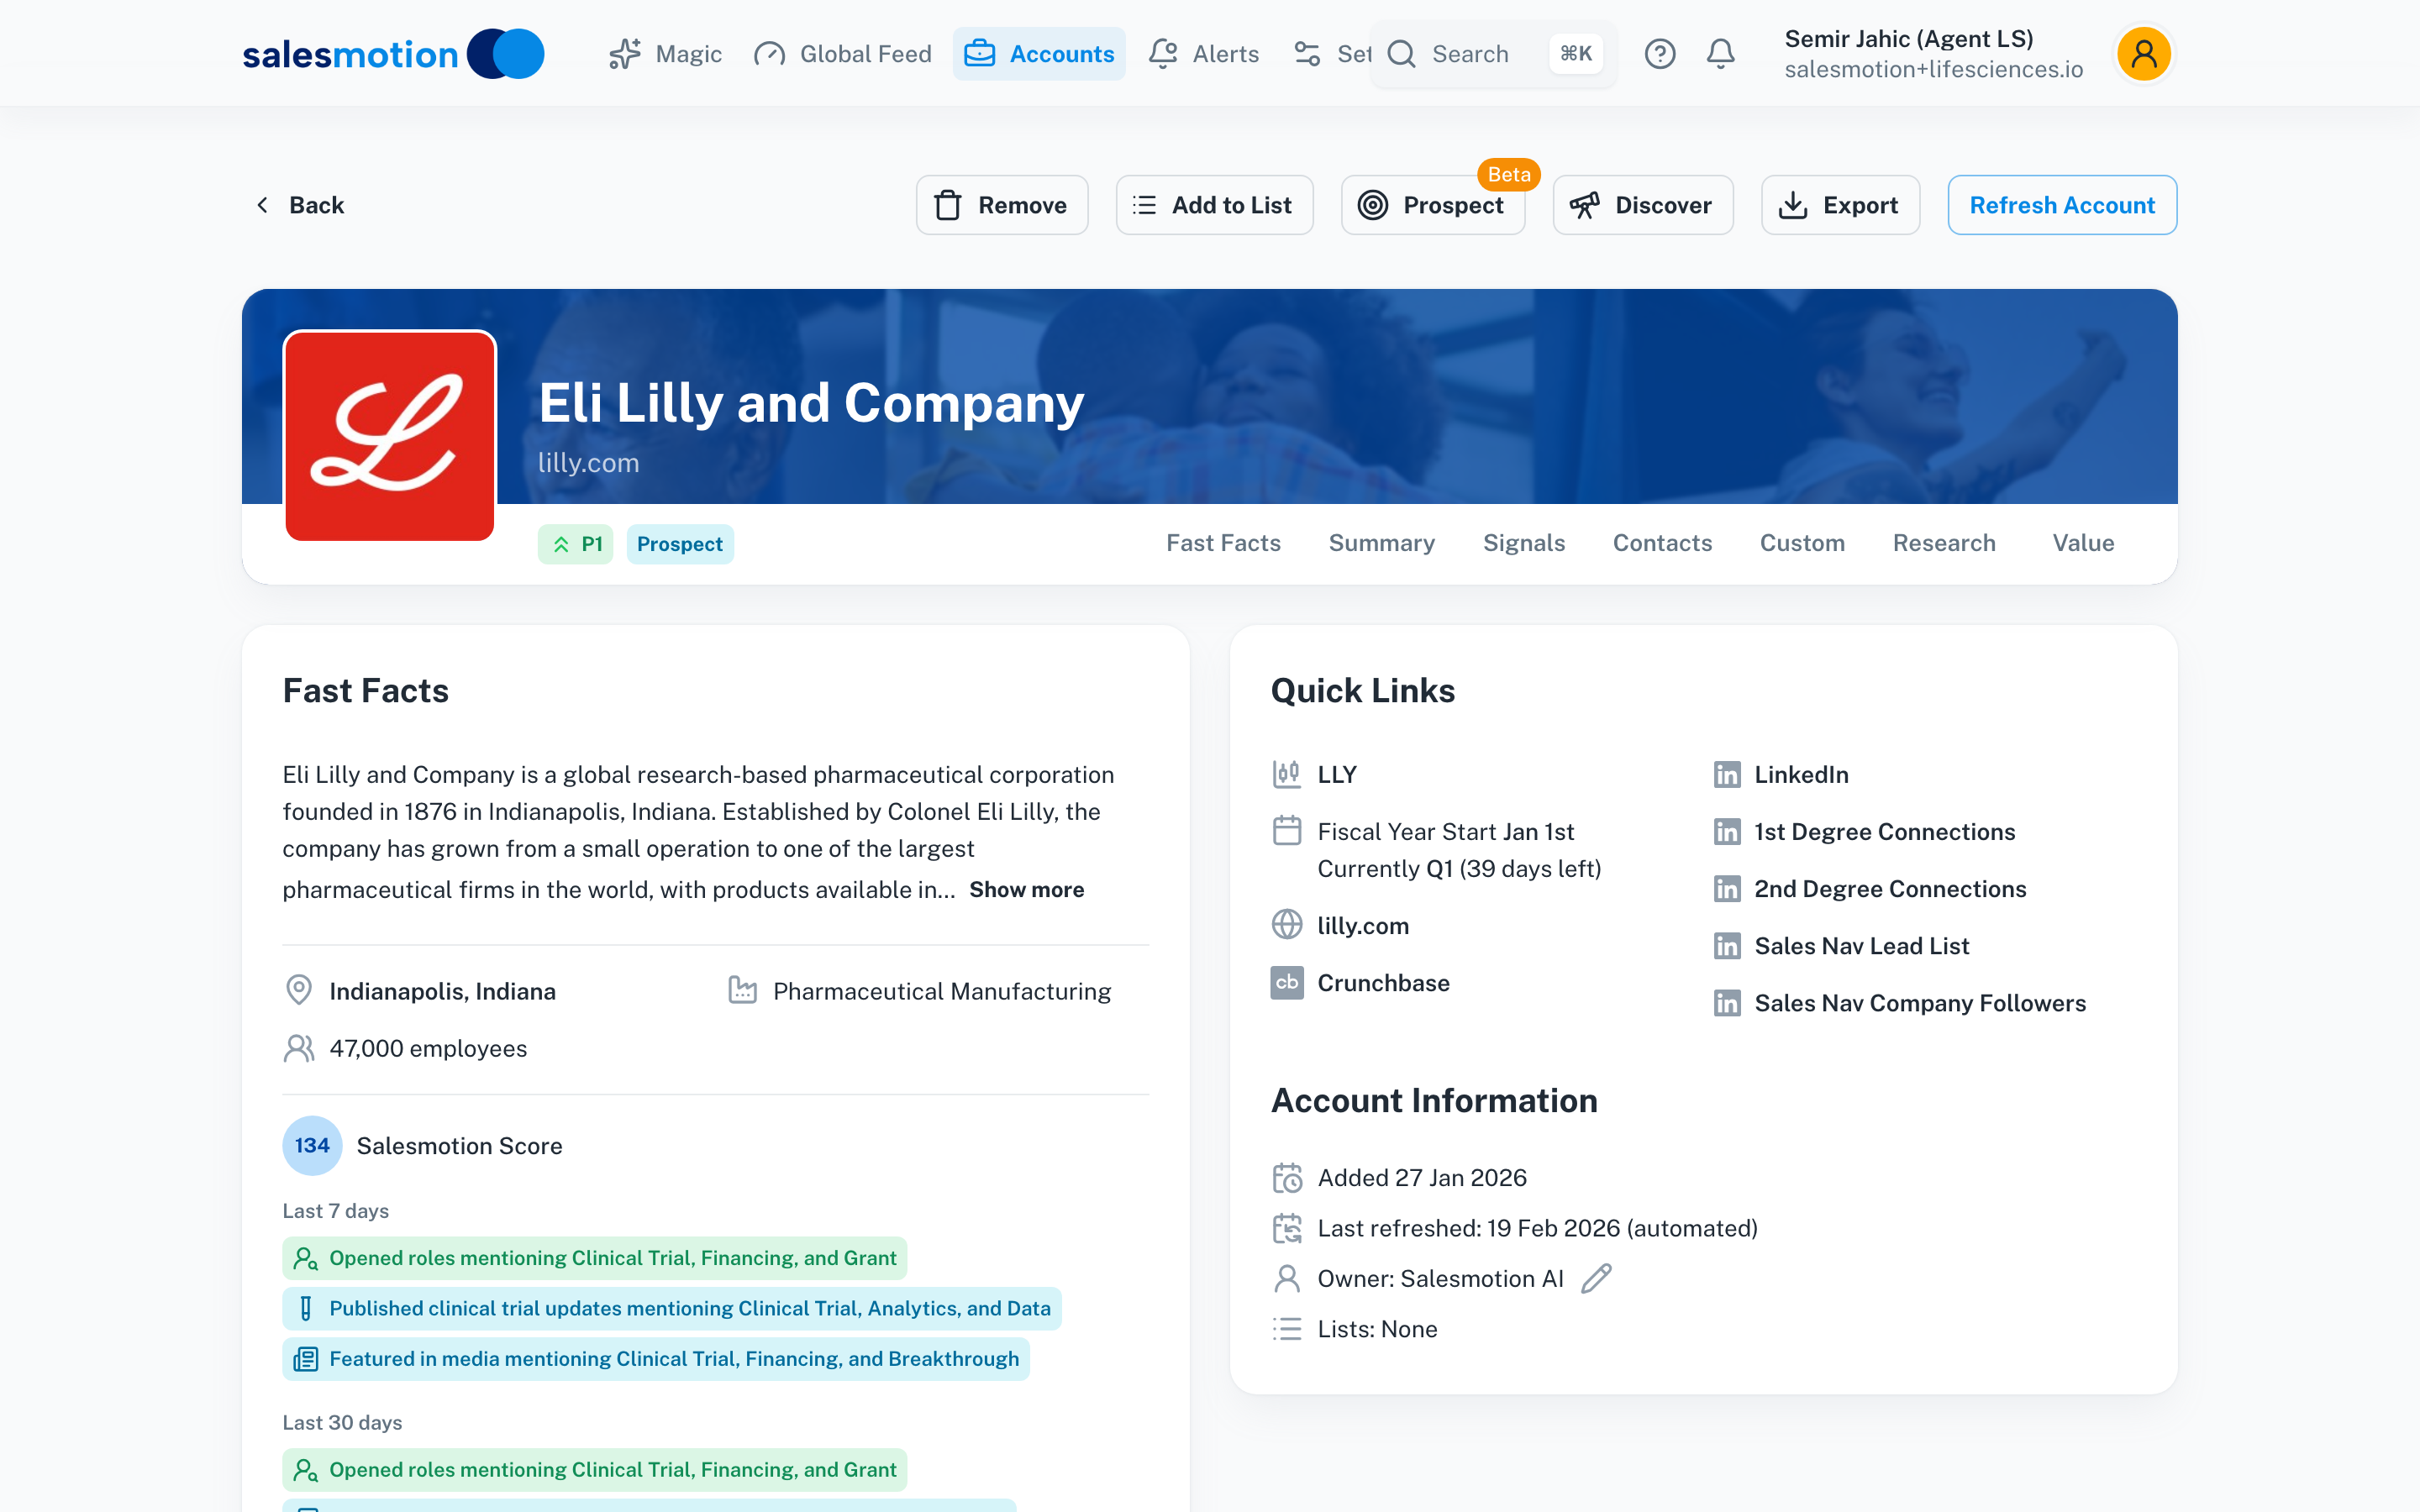 Account intelligence that synthesizes clinical, financial, and strategic signals into a single view, replacing manual research across fragmented sources.
From Signals to Pipeline: An End-to-End Example
Here is how the leading indicator playbook works when the signals connect.
Week 1 signal: Your monitoring platform flags that a mid-cap pharma company has posted 14 new roles in two weeks. Eight are Clinical Research Associates referencing "Phase III" and "oncology." Three are regulatory affairs positions. Two are biostatisticians. One is a VP of Medical Affairs.
Week 1 context: You cross-reference with earnings call transcripts from the previous quarter. The CEO mentioned "advancing our lead oncology asset toward registrational studies" and "evaluating strategic partnerships to accelerate our clinical timeline." The company's top-selling cardiovascular drug faces patent expiration in 16 months.
Week 2 research: Patent filings show the company secured composition-of-matter patents for a novel checkpoint inhibitor 14 months ago. A Series D extension of $180M closed 5 months ago with a healthcare-focused lead investor. The clinical pipeline page on their website was updated to show the oncology asset in "Late Phase II."
Week 2 outreach: Your rep now has a complete picture. This company is under patent cliff pressure, investing in oncology as their next growth platform, and actively staffing for Phase III. The outreach references the pipeline expansion, the operational scaling challenge (14 hires in two weeks means they are moving fast), and the timeline pressure created by the patent expiration. No generic pitch. A conversation rooted in what the company is actually doing.
Week 8: ClinicalTrials.gov shows a new Phase III registration for the oncology asset. Your competitors see it and start reaching out. Your rep is already three conversations deep with the VP of Clinical Operations.
This is not hypothetical. It is the pattern Cytel's commercial team follows after consolidating five research tools into one platform and cutting account research time by 50%. Before, their reps were spending hours manually assembling this kind of picture. Now, signals surface automatically and reps spend their time on conversations, not research.
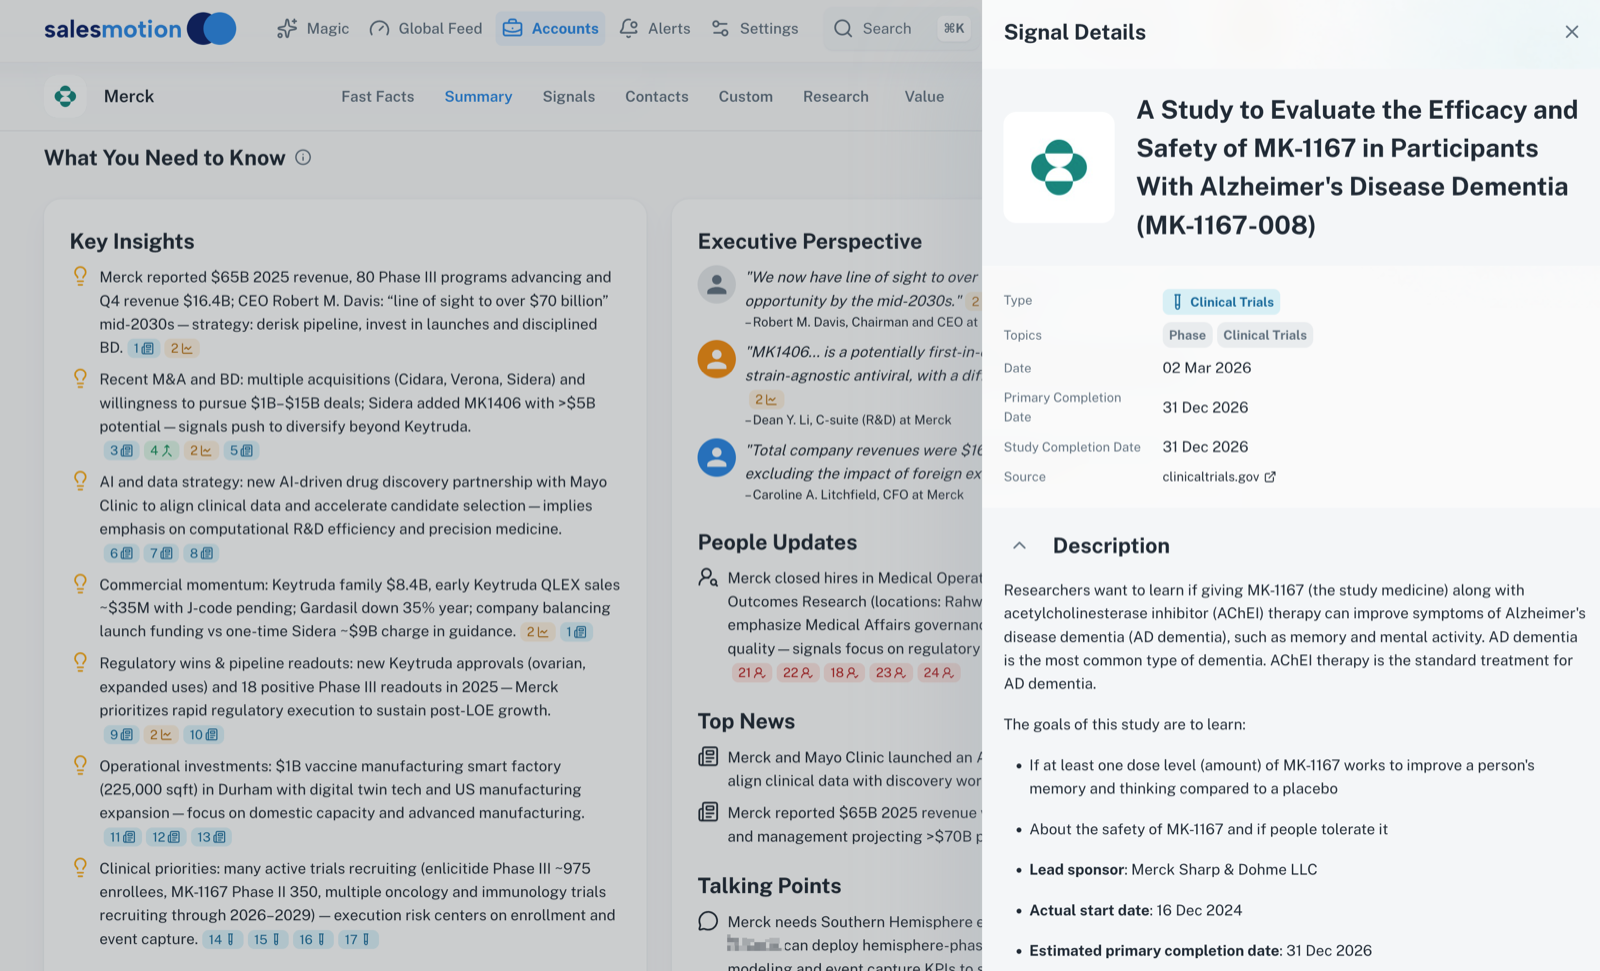 Clinical trial intelligence embedded in the account view, showing active studies, phase status, and enrollment data alongside other buying signals.
See Salesmotion on a real account
Book a 15-minute demo and see how your team saves hours on account research.
Building Your Life Sciences Signal Playbook
If your team is still relying on ClinicalTrials.gov as a primary prospecting source, here is a practical path to building a signal-based approach.
Step 1: Define your signal categories. At minimum, monitor these five: hiring activity (clinical operations, regulatory, commercial), earnings call language (pipeline, efficiency, consolidation), funding events (Series B+ with clinical intent), patent filings and expirations, and clinical trial activity (as a confirmation signal, not a leading one).
Step 2: Map signals to buying behavior. Not every signal means the same thing. A hiring surge in regulatory affairs means something different than a hiring surge in commercial operations. Build a simple matrix: signal type, what it indicates, which of your solutions it maps to, and the recommended outreach timing.
Step 3: Connect signal monitoring to your CRM. Signals that do not reach reps in context are wasted. Territory-based alert routing that delivers signals directly into the account record, alongside contact information and relationship history, is the difference between "interesting data" and "actionable intelligence." For teams building this capability, our guide on signal-based prospecting for life sciences covers the workflow in detail.
Step 4: Measure leading indicator coverage, not just activity. Track what percentage of your target accounts have active signal coverage. If you are monitoring 200 accounts but only getting signals on 80, you have a 40% coverage gap.
Step 5: Train reps on signal interpretation, not just signal consumption. A rep who sees a hiring alert and sends a generic "I noticed you're hiring" email has wasted the signal. A rep who connects the hiring alert to the earnings call language, the patent timeline, and the funding round, and references all of it in a two-sentence email, has earned a meeting.
For more on building signal-driven workflows specifically for life sciences buying signals, including sub-sector breakdowns for pharma, CROs, medtech, and diagnostics, see our comprehensive guide.
Key Takeaways
- ClinicalTrials.gov is a lagging indicator for sales purposes. Trials are registered after CRO partners have been selected, vendor budgets allocated, and operational planning completed. The sales cycle is over, not beginning.
- Hiring signals are the most reliable leading indicator in life sciences. Job titles reveal pipeline stage (Phase I pharmacology vs. Phase III CRA clusters vs. commercial launch MSLs), and hiring surges typically precede trial registrations by 4 to 6 months.
- Earnings call keywords like "pipeline acceleration," "registrational," and "vendor consolidation" carry legal weight and signal concrete budget decisions, not aspirational statements.
- Series B+ funding in biotech almost always means clinical trials are coming within 6 to 12 months. Cross-reference the funding amount and investor profile with the company's pipeline stage.
- Most life sciences teams are running 4 to 6 fragmented tools. The teams that connect hiring, earnings, clinical, funding, and patent signals into a single account view, like Salesmotion does for teams like Cytel, spot opportunities months before competitors relying on any single data source.
- Signal monitoring is only valuable if signals reach reps in context, connected to CRM data, contact information, and relationship history. Adoption fails when signals feel too broad or disconnected from the account.
- The patent cliff ($300B+ in revenue losing protection by 2030) is the macro driver underneath all of this. Every pharma company's response to patent pressure, whether M&A, R&D investment, or operational optimization, creates downstream buying opportunities.
Frequently Asked Questions
Why is ClinicalTrials.gov considered a lagging indicator for sales teams?
Under federal law, sponsors must register interventional studies within 21 days of enrolling the first participant. But enrollment happens after CRO partner selection, site contracting, and vendor budget allocation, all of which occur months earlier. NIH enforcement data shows that only 37% of required trials met the one-year results reporting deadline, with a median tardiness of 400 days. For sales teams, this means the trial registration is a confirmation of decisions already made, not a signal to start selling.
What hiring signals should life sciences sales teams monitor?
The highest-value hiring signals vary by what you sell. For CRO sales teams, clusters of Clinical Research Associate and biostatistician postings referencing a specific therapeutic area and trial phase are the strongest indicators of upcoming outsourcing needs. For commercial technology vendors, VP of Commercial Operations, Medical Science Liaison, and market access roles signal launch readiness. For analytics and operational efficiency sellers, watch for Director of Sales Operations and VP of Business Intelligence roles, which indicate process investment. According to IntuitionLabs research, regulatory hiring tracks directly with the product pipeline.
How does the patent cliff affect B2B selling into pharma in 2026?
The pharmaceutical patent cliff is the dominant macro signal right now. Analysis from Ropes & Gray documented 193 M&A transactions totaling $220 billion in 2025 as companies scrambled to fill pipeline gaps. Companies facing patent expirations respond predictably: they acquire pipeline assets (driving M&A and integration projects), increase R&D spending (driving CRO outsourcing), and optimize operations (driving technology and analytics purchases). Mapping patent expiration timelines to your target account list helps prioritize which companies are under the most pressure to buy.
What is the difference between Zymewire and broader signal intelligence platforms?
Zymewire specializes in pharma-specific intelligence, covering clinical trials, drug pipelines, funding events, and regulatory filings. It is strong for CRO teams that need clinical signal depth. Broader signal intelligence platforms cover a wider range of indicators, including earnings call language, hiring patterns, patent filings, executive changes, and news, then connect those signals into a unified account view. The tradeoff is specialization vs. breadth. Teams that only sell into pharma may prefer Zymewire's depth. Teams that sell across life sciences sub-sectors (pharma, CROs, medtech, diagnostics) typically need the broader signal set. Our life sciences industry page covers how different team types approach this decision.
How do funding signals predict clinical trial activity in biotech?
In biotech, the funding round maps closely to the development stage. Seed and Series A capital funds discovery and preclinical research. Series B funding typically funds IND-enabling studies and early clinical work. Series C and beyond fund Phase II and Phase III trials. When a biotech closes a large Series B or C round with a healthcare-focused lead investor, the capital is almost certainly earmarked for clinical development within 6 to 12 months. Cross-referencing the funding amount, investor profile, and the company's publicly disclosed pipeline stage gives a reliable prediction of when CRO services, clinical technology, and operational vendors will be needed.