For years, marketing and sales teams lived in two different worlds. Marketing would celebrate hitting their MQL target, while the sales team across the hall was drowning in contacts who weren't actually ready to buy. This misalignment wasn't just a minor annoyance; it was a major source of friction and wasted resources, with both teams chasing quantity over quality.
The good news? High-growth companies are finally breaking this cycle. They've stopped treating MQLs as their North Star. Instead, they’re adopting demand generation metrics that directly map back to what really matters: revenue.
Moving Beyond MQLs to Revenue-Focused Metrics
This new approach shifts the focus from simply filling a spreadsheet with leads to building a predictable growth engine. It’s a move from tracking activities to measuring real business outcomes.
The Great Metric Shift
The whole industry is making a massive pivot. It's no longer about how many leads you can cram into the top of your funnel, but about how much qualified pipeline and revenue you can predictably create from your marketing efforts.
And this isn't just a hunch; the data backs it up.
A landmark study revealed that 49% of B2B marketers now cite 'revenue generated' as their top success metric, completely overtaking traditional lead volume. The same study found that improving conversion rates is now the number one priority for demand generation teams. You can see the full findings in the 2020 Demand Generation Benchmark Study.
This shift solves the core problem that plagues so many sales floors: too many low-quality signals and not enough time for manual research. Instead of having reps chase down every single "lead," winning teams now focus their energy on accounts that show genuine buying intent.
The ideal flow connects marketing efforts directly to pipeline and, ultimately, revenue. It’s a straight line from interest to cash.
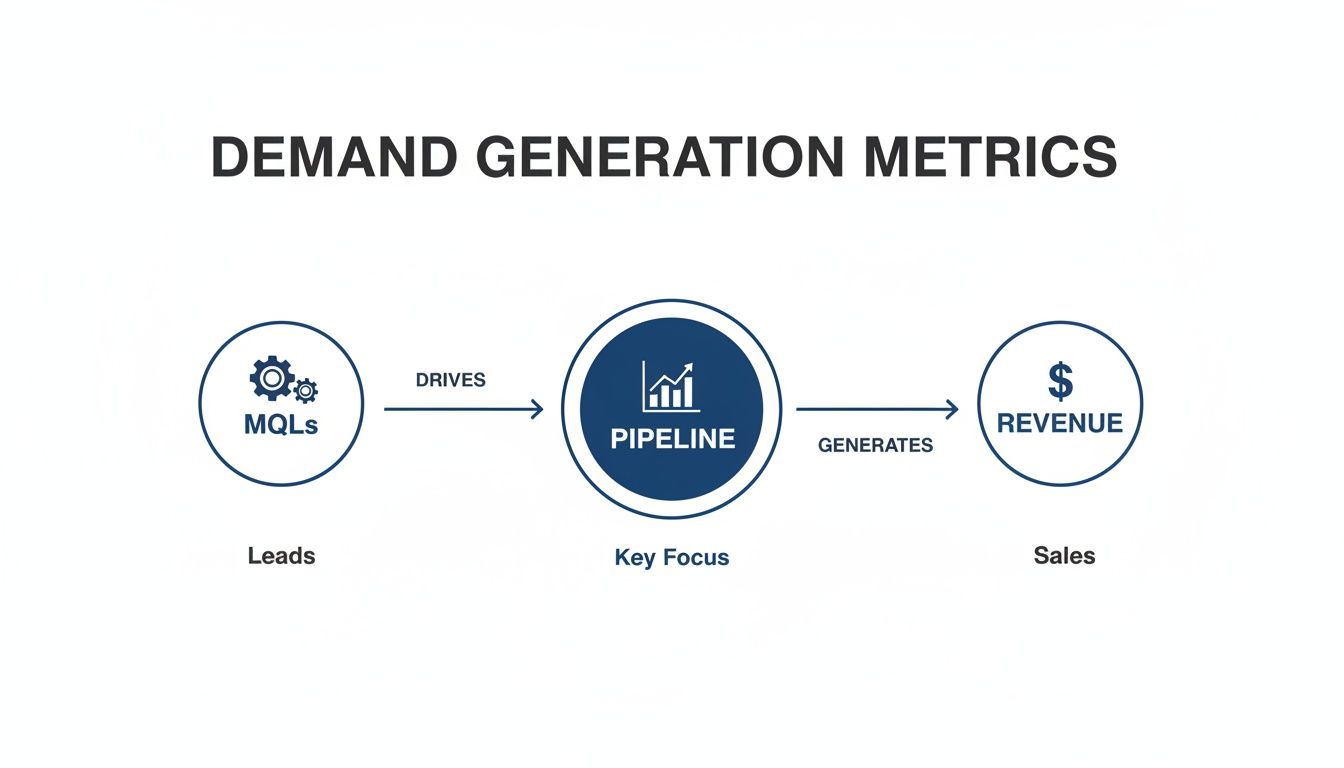
Think of MQLs as just the starting point. The real goal is to convert that initial flicker of interest into something tangible for the business.
Old Metrics vs. Revenue-Focused Metrics
So, what does this change actually look like day-to-day? It means ditching the old, often misleading vanity metrics for KPIs that give you a clear line of sight to revenue. Getting this right is the first step toward building a demand generation strategy that actually works.
For a deeper dive, check out our complete guide to essential B2B marketing KPIs.
Here’s a side-by-side comparison of the old way versus the new, revenue-focused approach.
| Metric Category | The Old Way (Vanity Metric) | The New Way (Revenue Metric) |
|---|---|---|
| Lead Quality | Total MQLs | MQL-to-SQL Conversion Rate |
| Cost | Cost Per Lead (CPL) | Cost Per Qualified Meeting (CPQM) |
| Success | # of Demos Booked | Pipeline Sourced from Marketing |
| Efficiency | Website Traffic | Sales Cycle Length |
This table highlights the fundamental move from measuring marketing’s activity to measuring its impact. It’s a simple change on paper, but it completely transforms how you think about growth.
See Salesmotion in action
Take a self-guided interactive tour — no signup required.
From MQL to SQL The First Critical Conversion Point
The journey from a curious prospect to a paying customer is full of milestones, but few are as revealing as the handoff from marketing to sales. This is where your demand generation engine faces its first real test.
The MQL-to-SQL conversion rate is the KPI that tells you how many of your marketing-qualified leads (MQLs) are actually worth a salesperson’s time. Think of it as the ultimate quality check.
While MQL volume shows you how much noise you're making, the MQL-to-SQL rate tells you how effective that noise is. A high rate means marketing is teeing up leads that sales genuinely wants to talk to. A low rate signals a disconnect that burns time, money, and morale.
Diagnosing a Low MQL to SQL Conversion Rate
If your conversion rate is lagging, it's a clear signal that marketing’s definition of "qualified" doesn't match what sales actually needs to start a conversation. This is one of the oldest and most common friction points between the two teams.
So, what should you aim for? While benchmarks vary, top-performing teams see this as a core ROI metric. The best demand gen programs consistently hit MQL-to-SQL conversion rates above 20-30% on their best campaigns, proving a direct line from marketing activity to sales pipeline. You can see more on how leaders prove ROI from Televerde's analysis of high-impact programs.
To get this crucial number for your own team, the formula is simple:
MQL-to-SQL Conversion Rate = (Total Number of SQLs / Total Number of MQLs) x 100
For example, if marketing generates 500 MQLs in a quarter and sales accepts 100 of them as SQLs, your conversion rate is 20%. Tracking this over time is the fastest way to diagnose the health of your lead handoff process.
Common Causes of a Poor Conversion Rate
A low MQL-to-SQL rate is almost never a single problem. It's usually a combination of factors that creates a chasm between marketing's idea of a good lead and what sales sees in the trenches.
Here are the most common culprits:
- Misaligned Lead Scoring: Your scoring model might be giving too much weight to soft engagements (like a single webinar view) while undervaluing high-intent signals (like multiple visits to the pricing page).
- Weak Timing Triggers: An MQL might fit the profile perfectly, but there's no compelling "why now?" event that gives sales a reason to engage. The timing is off.
- Disconnected Qualification Criteria: Sales and marketing have fundamentally different definitions of an ideal customer profile (ICP) or what BANT (Budget, Authority, Need, Timeline) criteria are non-negotiable.
Fixing this is mission-critical. For teams wrestling with this, it often helps to get everyone in a room and visually map how leads are defined and passed through your CRM. Our guide on mapping lead conversions in Salesforce offers a clear starting point for that conversation.
The dashboard below is a perfect example of how teams can collaboratively analyze these pipeline metrics to bridge the MQL-SQL gap.

This kind of shared analysis is what turns MQL generation into real pipeline creation.
Ultimately, the most powerful way to boost your MQL-to-SQL rate is to enrich leads with timely, relevant buying signals. An MQL shouldn't just be a contact who downloaded an ebook; it should be an account showing real buying momentum.
Imagine your sales team knew an MQL's company just announced a Series B funding round or hired a new CRO. That context instantly transforms a cold follow-up into a strategic, relevant conversation, making it far more likely to convert into a genuine sales-qualified opportunity.

“Salesmotion has been a game-changer for me. I used to spend 12 hours a week on prospect research, now it's down to 4. Plus I'm finding stuff I was totally missing - podcasts, news mentions, the good bits.”
George Treschi
Account Executive, FY25 President's Club, Sigma
The True Cost of a Quality Meeting
So, are your demand generation efforts actually making money? It’s easy to get caught up in top-of-funnel activity that creates the illusion of progress, but for revenue leaders, what really matters is the financial clarity at the bottom of the funnel. This is where you stop counting leads and start counting dollars.
To figure out the real return on your demand efforts, you have to go past the vanity metrics. You need to get a clear, honest look at the true cost of getting a quality meeting. It all comes down to calculating Customer Acquisition Cost (CAC). This is the kind of financial discipline that separates feel-good marketing from programs that actually drive revenue. Two numbers tell this story better than any others: Cost Per Qualified Meeting and Pipeline ROI.

These aren’t just numbers for a spreadsheet. They’re non-negotiable for any leader trying to justify their budget or scale a team. This is the ultimate proof of performance.
Calculating Your Cost Per Qualified Meeting
The Cost Per Qualified Meeting (CPQM) is a metric that cuts right through the noise. It tells you exactly how much you’re spending to get a salesperson into a real conversation with someone who fits your ideal customer profile and has a legitimate need.
Figuring it out is pretty simple:
CPQM = Total Sales & Marketing Costs for a Campaign / Number of Qualified Meetings Booked
For instance, if you pour $50,000 into a campaign that books 100 qualified meetings, your CPQM is $500. That number is your efficiency baseline.
This metric is so important because it exposes the "marketing data mirage"—where thousands of webinar sign-ups mask a total failure to generate actual business impact. When you track CPQM, you’re forced to focus on quality over sheer volume, which stops you from wasting money.
Driving Down CPQM with Smarter Targeting
A high CPQM is a huge red flag. It usually points to one of two things: poor targeting or irrelevant messaging. The fastest way to bring that cost down is by dialing in your relevance and timing. Stop treating every lead the same and start focusing on accounts that are showing real intent to buy.
This is where timely intelligence becomes a game-changer.
- Turn Cold Calls into Warm Conversations: Instead of a generic script, imagine your rep knows the prospect’s company just launched a major European expansion or hired a new VP of Operations.
- Create "Why Now?" Moments: A signal like a fresh funding round or a key executive move gives your team an immediate and compelling reason to connect.
This level of relevance dramatically boosts the odds of booking a meeting, which directly lowers your CPQM. You're no longer burning cash chasing leads who don't care; you're investing in timely, strategic conversations.
Measuring the Ultimate Return: Pipeline ROI
While CPQM is all about efficiency, Pipeline ROI measures effectiveness. It answers the one question every CRO has: "For every dollar we put into this marketing program, how many dollars of pipeline did it generate?"
Here’s the simple formula you should have on your dashboard:
Pipeline ROI = Total Pipeline Generated from Campaign / Total Campaign Cost
Let’s go back to our example. If your $50,000 campaign generates $500,000 in qualified pipeline, your Pipeline ROI is 10x. This is the language that boards and executive teams understand.
It’s a hard truth, but a huge chunk of marketing spend goes to waste. A study from Gartner found that 29% of B2B marketing budgets are wasted on campaigns that look good on paper but produce zero revenue. By tracking both CPQM and Pipeline ROI, you ensure your budget is part of the solution, not the problem.
How AI-Driven Signals Amplify Every Metric
Your demand generation metrics are a report card on your team’s actions. But let's be honest, a great metric isn't just a number on a dashboard; it’s proof that your team is taking smarter, faster actions than the competition. Metrics improve when behavior improves, and this is where AI-driven signals become a game-changer.
Think of it as the "how" behind the "what." Instead of just tracking metrics after the fact, you start actively influencing them. AI doesn’t just find data; it surfaces the specific, timely triggers that let your team engage with a level of relevance that’s almost impossible to achieve manually. This amplifies the performance of every single KPI we’ve discussed.
It’s the shift that turns a sales team from being reactive and inconsistent into a proactive, disciplined engine for pipeline growth. It’s the difference between manual guesswork and automated, timely engagement.
From Manual Research to Automated Relevance
Let’s walk through a "before and after" story that most sales leaders will recognize immediately.
Before AI Signals: A sales team is stuck doing manual research. Reps spend hours scrolling through LinkedIn, setting up news alerts, and trying to piece together a halfway-decent reason to reach out. The process is slow, inconsistent, and the context they find is usually low-quality. The result? Generic outreach, dismal reply rates, and a painfully high Cost Per Qualified Meeting (CPQM).
After AI Signals: Now, picture that same team is working with AI. An AI Signal Agent monitors their target accounts 24/7. When a prospect’s company announces a new product line that creates a clear need for your solution, the agent doesn't just flag it—it explains why it matters and who to contact.
The rep gets a real-time alert with the exact context needed for a sharp, relevant message. This isn't a cold call anymore; it’s a strategic, well-timed conversation starter. The impact on your demand generation metrics is immediate and measurable.
By transforming raw data into actionable intelligence, AI agents turn vague interest into concrete opportunities. This shift is essential for teams looking to move beyond simple lead generation and into predictable pipeline creation.
To really get under the hood of this, you can even transform the raw data from your sales calls and customer demos into actionable metrics. Exploring how conversation intelligence can structure this data is key to understanding what actually resonates with buyers and what falls flat.
A Tangible Impact on Your Key Metrics
This isn’t just theory; it’s a practical way to drive real results across your entire funnel. Let’s connect the dots between AI-driven signals and the specific metrics that matter most.
-
Higher MQL-to-SQL Conversion: An AI Research Agent provides deep, structured account briefs. When marketing passes over an MQL, sales already has the context—strategic initiatives, key stakeholders, recent news—to qualify it effectively. This shared intelligence gets both teams on the same page, dramatically increasing the percentage of MQLs that sales accepts as legitimate opportunities. For those looking to refine this process further, our guide on AI lead scoring provides a practical framework.
-
Lower Cost Per Qualified Meeting (CPQM): An AI Prospector Agent uses the intelligence from signals and research to craft personalized outreach. Instead of sending generic templates, reps can anchor their messages to real events, like a recent funding round or a key executive hire. This relevance cuts through the noise, leading to more replies and more meetings booked from the same level of effort, which directly slashes your acquisition cost.
-
Increased Pipeline ROI: By focusing your team’s efforts on accounts that are actively showing buying intent, you stop wasting resources on those that aren't ready. This improved focus means that every dollar you invest in marketing and sales is far more likely to generate qualified pipeline, boosting your overall return.
Ultimately, AI-driven intelligence gives your team an unfair advantage. It automates the homework, surfaces the "why now," and empowers your reps to have the value-driven conversations that lead to measurable, predictable pipeline growth.

“The Business Development team gets 80 to 90 percent of what they need in 15 minutes. That is a complete shift in how our reps work.”
Andrew Giordano
VP of Global Commercial Operations, Analytic Partners
Building Your Revenue-Focused Metrics Dashboard
You can't manage what you don't measure. We've all heard it a thousand times. But in a world drowning in data, the real challenge isn't tracking metrics—it's tracking the right ones.
A great dashboard isn't a data dump. It’s a strategic tool that tells a clear, simple story about how your demand generation efforts connect directly to revenue. This is your blueprint for building a dashboard that a CEO or CRO will actually look at and understand.

Forget theory. We're focused on at-a-glance clarity that connects every marketing action to a business outcome. The goal is to get past vanity metrics and build a single source of truth for revenue performance. This is how you create a culture of data-driven accountability, where everyone on the team sees exactly how their work hits the bottom line.
Structuring Your Funnel-Based Dashboard
The most effective dashboards mirror the customer journey. When you organize your demand generation metrics by funnel stage, you can instantly spot bottlenecks and diagnose the health of your entire revenue engine.
A logical flow starts at the top with awareness and moves right down to closed-won deals:
- Top-of-Funnel (Awareness): How well are we engaging our target accounts?
- Middle-of-Funnel (Consideration): Are we turning that engagement into qualified interest?
- Bottom-of-Funnel (Decision): Are we converting that interest into pipeline and revenue?
This structure ensures you’re not just looking at isolated numbers. Instead, you're seeing a connected system where performance at one stage directly impacts the next.
Key Metrics for Your Executive Dashboard
To make a dashboard truly actionable, each metric needs a clear owner, a defined purpose, and a desired trend. This simple framework turns data into a plan. It answers not just "What's happening?" but "Who owns it?" and "What should we do next?"
Here’s a breakdown of the KPIs we see on the most effective revenue-focused dashboards.
Essential Demand Generation Dashboard KPIs
| Metric | Primary Owner | What It Measures | Desired Trend |
|---|---|---|---|
| Engaged Accounts | Head of Marketing | The number of ICP accounts showing buying intent signals. | Increasing |
| MQL-to-SQL Conversion Rate | VP of Marketing & Sales | The percentage of marketing leads that sales accepts. | Increasing |
| Cost Per Qualified Meeting | Head of Demand Gen | The cost-effectiveness of booking a sales-ready meeting. | Decreasing |
| Marketing-Sourced Pipeline | Head of Marketing | The total pipeline value generated by marketing activities. | Increasing |
| Sales Cycle Length | Head of Sales/RevOps | The average time it takes to close a deal from first touch. | Decreasing |
| Win Rate from Qualified Opps | Head of Sales | The percentage of qualified opportunities that close. | Increasing |
This table is more than just a list of metrics; it’s a blueprint for accountability across marketing and sales. For a deeper dive into the pipeline itself, check out our guide on critical sales pipeline metrics.
Asking the Right Questions
Behind every metric should be a single, powerful question it answers. This is what transforms a dashboard from a report into a strategic conversation starter for your leadership team.
For example, when the CEO looks at Marketing-Sourced Pipeline, the question isn't just "What's the number?" It's "Is marketing generating enough high-quality pipeline to hit our future revenue targets?"
Likewise, when your CRO reviews the MQL-to-SQL Conversion Rate, they're really asking, "Are marketing and sales perfectly aligned on what a good lead looks like?"
This approach ensures your dashboard isn't just presenting data; it's providing answers. It creates a direct line of sight from daily team activities to the high-level business goals that matter most, making your demand generation metrics the true engine of predictable growth.
Common Questions About Demand Generation Metrics
Even the best revenue dashboard can't answer every question that pops up when you shift from vanity metrics to what really matters. As you guide your team through this change, a few common roadblocks always seem to surface.
Let's tackle them head-on with some clear, practical answers to get your marketing and sales teams pulling in the same direction.
How Do I Get Marketing and Sales to Agree on These Metrics?
Alignment doesn't start with metrics. It starts when both teams rally around a single, shared obsession: predictable revenue growth.
You have to shift the conversation away from hitting separate departmental targets—like MQL volume or call quotas—and towards building one high-performance revenue engine.
First, get the leaders from both teams in a room. Your only goal is to jointly define the stages of your funnel. What actually makes a meeting "qualified"? What are the non-negotiable criteria that make an account ready for a sales conversation? Write it all down.
Next, you formalize it in a Service Level Agreement (SLA). This isn't just a document; it's a pact. It outlines the commitments each team makes to the other.
- Marketing Commits: To deliver a specific number of Sales Qualified Leads (SQLs) each month that meet the exact criteria you just defined.
- Sales Commits: To act on 100% of those SQLs within a set timeframe, like 24 hours, and give honest feedback on lead quality.
This builds mutual accountability. To make it stick, all demand generation metrics must be transparent and visible to both teams. When you tie team goals—and even compensation—to shared pipeline and revenue outcomes, you finally break down the silos.
The ultimate alignment tool is a single source of truth for account intelligence. When both marketing and sales work from the same real-time context about a target account—its strategic priorities, recent news, and key players—arguments over lead quality simply fade away.
What Is a Realistic Timeframe to See Improvements After Implementing AI Signal Intelligence?
This is a great question. Leaders have to manage expectations while pushing for change. The good news is that you can see meaningful improvements in your leading indicators much faster than you might think. This doesn't have to take multiple quarters.
Within the first 30-60 days of using AI signal intelligence, you should see a clear lift in early-stage engagement. These are the first green shoots that prove your team's outreach is getting more relevant and timely.
Look for improvements in:
- Higher email reply rates: When your outreach is tied to a real, recent event (like a funding announcement or a new product launch), it just cuts through the noise.
- More meetings booked with the right personas: Signal-based outreach naturally targets the decision-makers involved in the very events you're tracking.
Meaningful shifts in core funnel metrics—the truest measure of your demand generation metrics' health—often show up within the first 90 days. As your team gets better at acting on automated signals, you'll see a direct impact on MQL-to-SQL conversion rates. The conversations are just better, which boosts conversions.
The big, strategic lagging indicators take a bit longer but represent the ultimate prize. These metrics typically require 6-12 months to measure accurately, as they depend on deals moving all the way through the pipeline to a close. These include:
- Shorter sales cycles
- Increased average deal size
- Higher win rates
The key is tracking both. The early wins build momentum and prove the strategy is working, while the long-term metrics confirm its direct impact on the bottom line.
My Team Is Overwhelmed with Data. How Do We Focus?
Data paralysis is real, and it’s getting worse. The answer isn't to track less, but to create a clear hierarchy for your metrics.
Not every metric is created equal, and not everyone on the team should be staring at the same dashboard.
Think of it as a pyramid. The very top holds the few North Star metrics guiding the entire company. As you move down, the metrics become more granular and tied to daily activities.
Level 1: Executive Team (CEO, CRO, Board) This group only needs 3-4 North Star metrics that tell the high-level story of business health.
- Total Pipeline Generated: Are we building enough of a pipeline to hit our future revenue targets?
- Pipeline ROI: Is our investment in sales and marketing actually creating a positive return?
- Customer Acquisition Cost (CAC): How efficient are we at acquiring new customers?
- Sales Cycle Length: How fast are we turning that pipeline into real revenue?
Level 2: Leadership (VPs of Sales & Marketing) This layer focuses on the core conversion points and efficiency metrics that directly drive those North Star numbers.
- MQL-to-SQL Conversion Rate: How aligned are our marketing and sales teams, really?
- Cost Per Qualified Meeting (CPQM): How efficiently are we generating sales-ready conversations?
- Deal Velocity: How quickly are deals moving between stages in our pipeline?
Level 3: Front-Line Managers & Reps This is where the rubber meets the road. This layer focuses on activity and efficiency metrics that individuals can directly control every single day.
- Meetings booked from target accounts
- Outreach-to-meeting conversion rate
- Activities per opportunity
This kind of hierarchy ensures that each person's metrics roll up to the layer above. It creates a crystal-clear line of sight from a rep's daily calls all the way up to the company's top-line revenue goals. This is how you stop data from being a source of overwhelm and turn it into a tool for focused, strategic action.
By using autonomous AI agents to transform signals into actionable workflows, Salesmotion helps revenue teams scale personalization, win timely conversations, and turn real account activity into measurable pipeline growth. Learn more at https://salesmotion.io.